INTRODUCTION
This guide helps you to deal with common issues and recommended solutions right from the pipeline creation to its execution. You will find them categorized into different sections. We will bring in more troubleshooting tips in our upcoming guide series.
SERVICE
Issue:
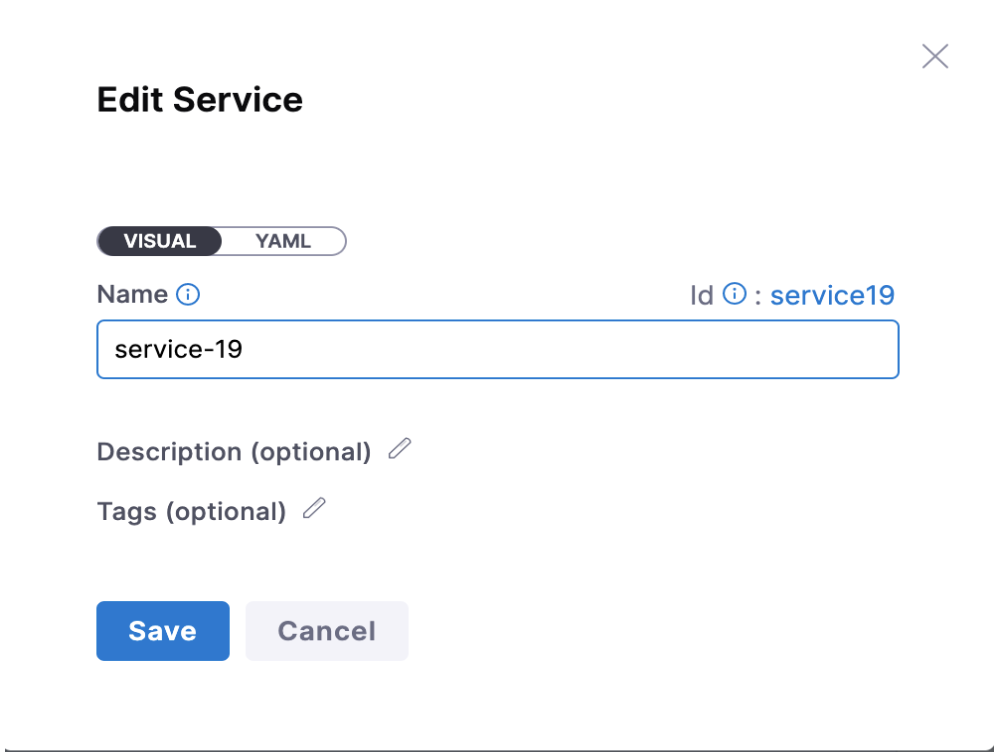
Can we use the same service name for dev, QA, and prod so that when I choose the same service, it will automatically take the same infra and execution mode, or do we need to mention all those in the cd deploy stage?
Solution:
We can use the same service to deploy in all environments, provided your infrastructure is templated/ parametrized and saved as input sets. While deploying the service, you can provide it as runtime input.
CONNECTORS
Issue:
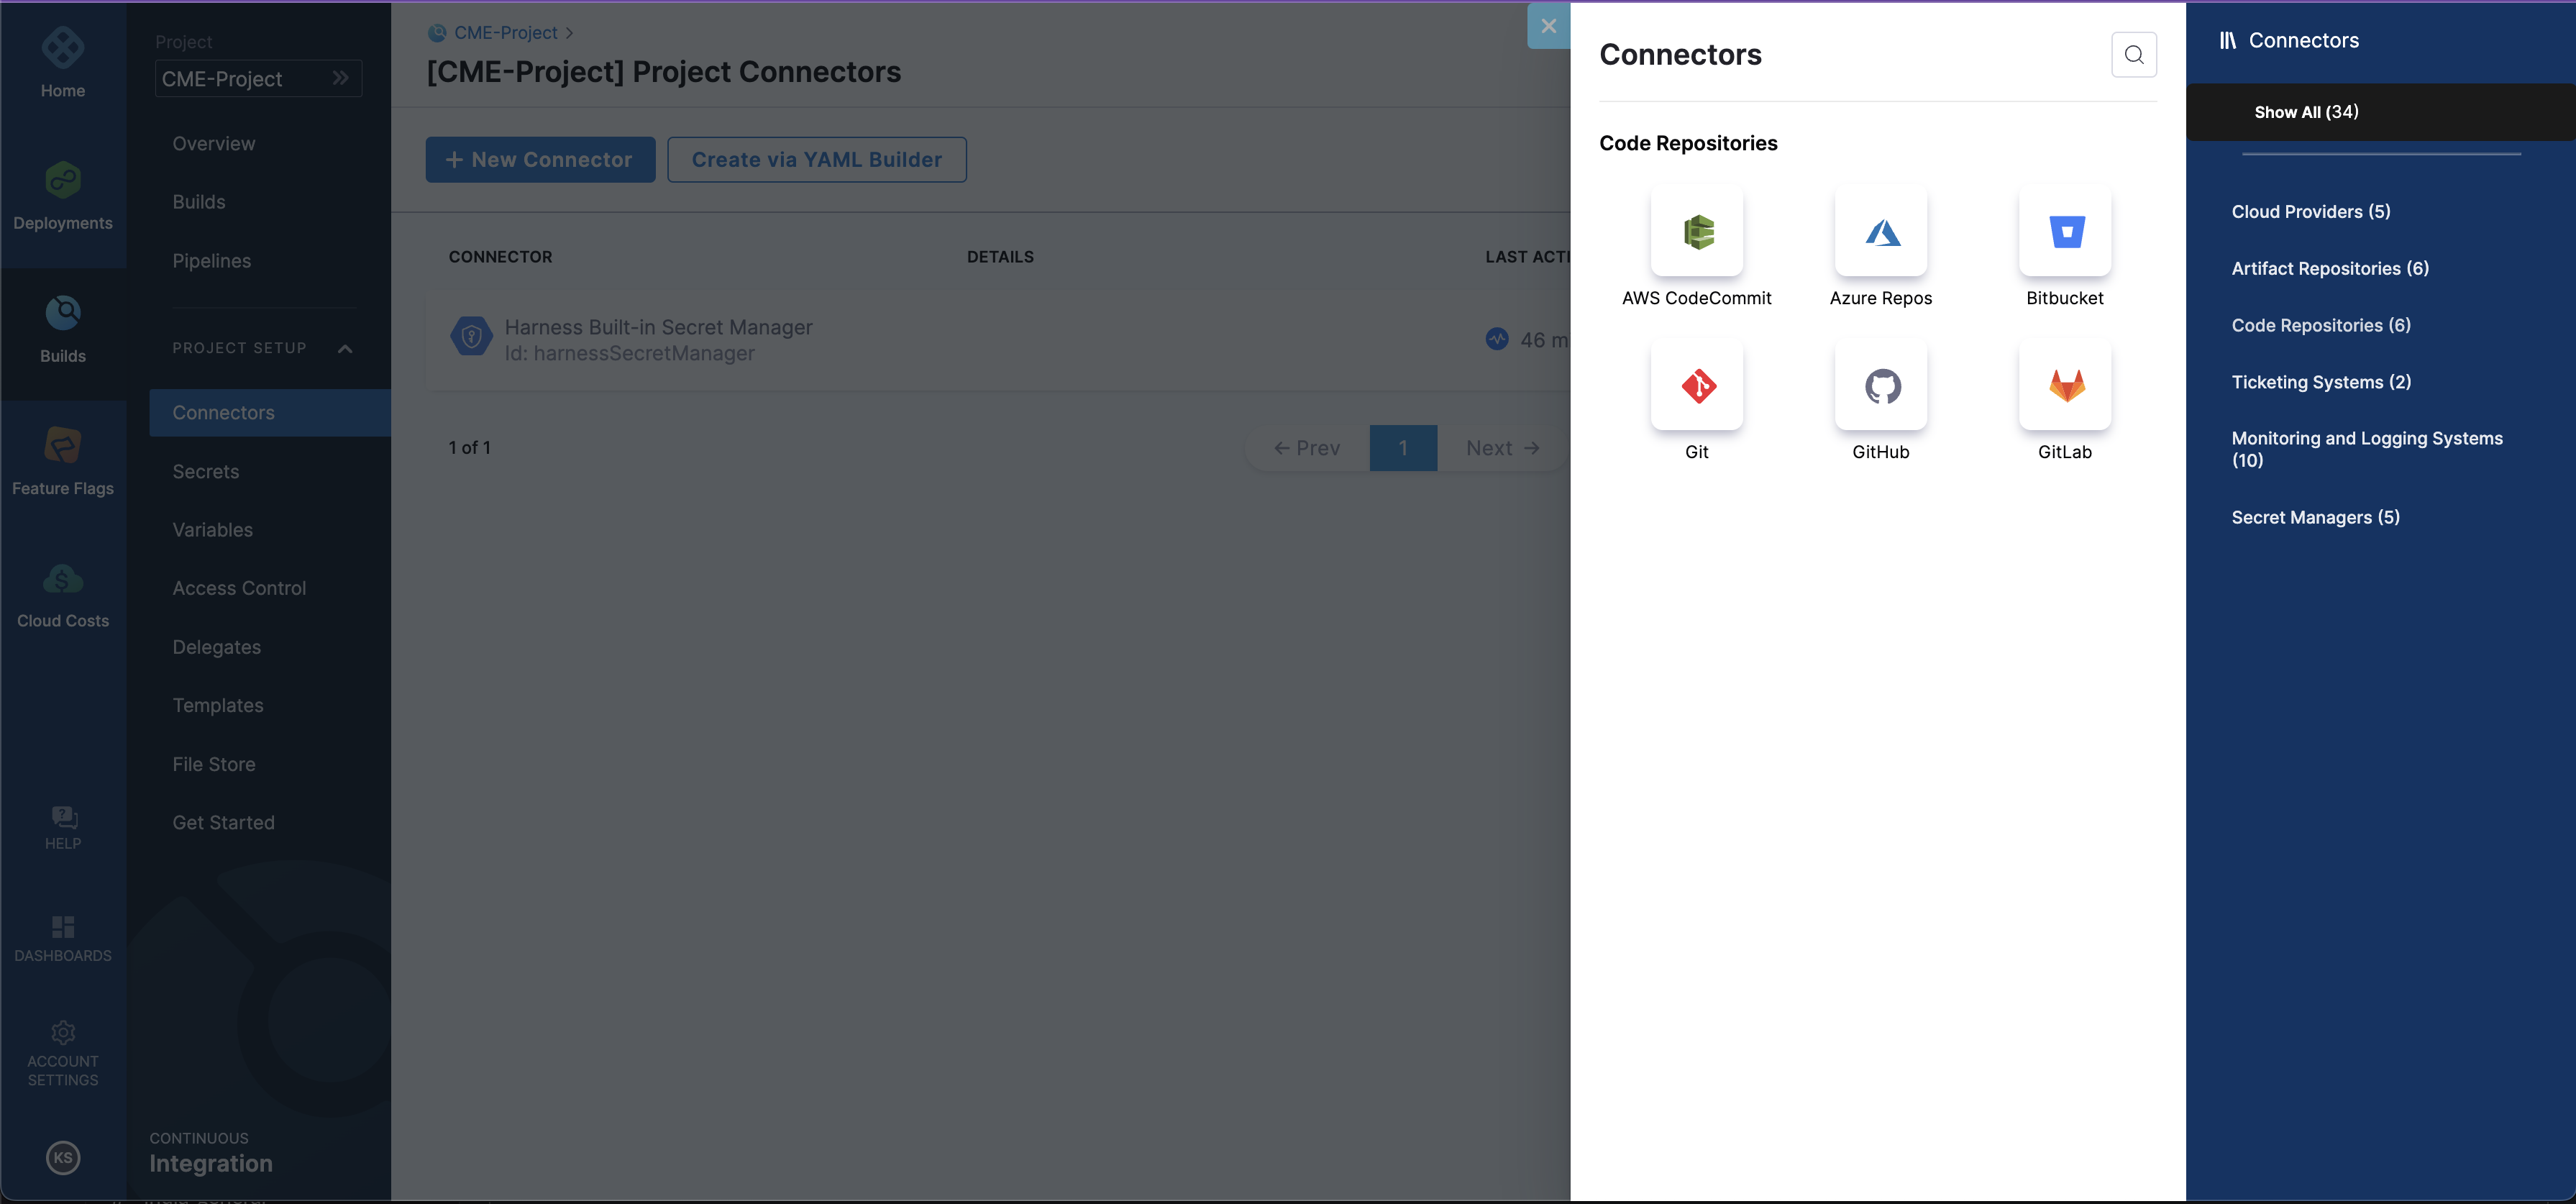
When a user is unable to create a git connector, not sure what URL to pick don’t know where to pick(not sure what URL has to be added under 'GitHub Repository URL').
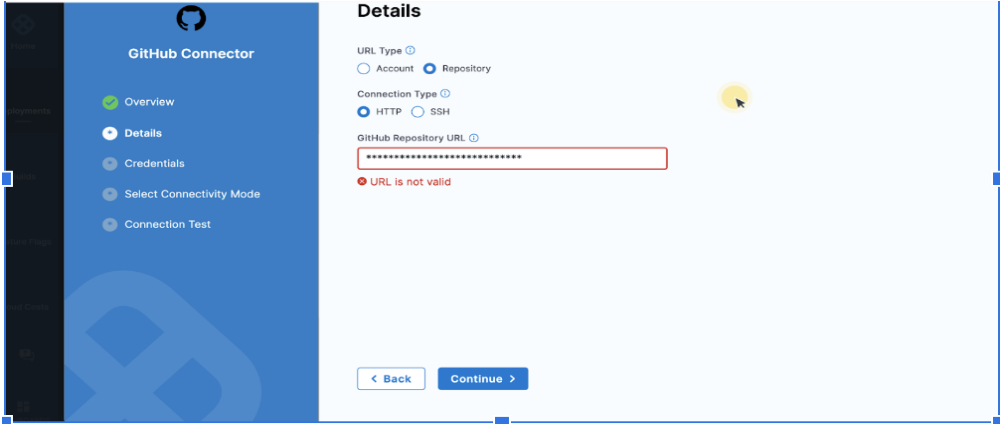
Solution:
Pattern URL looks like this: https://github.com/<account>/<repo>
Issue:
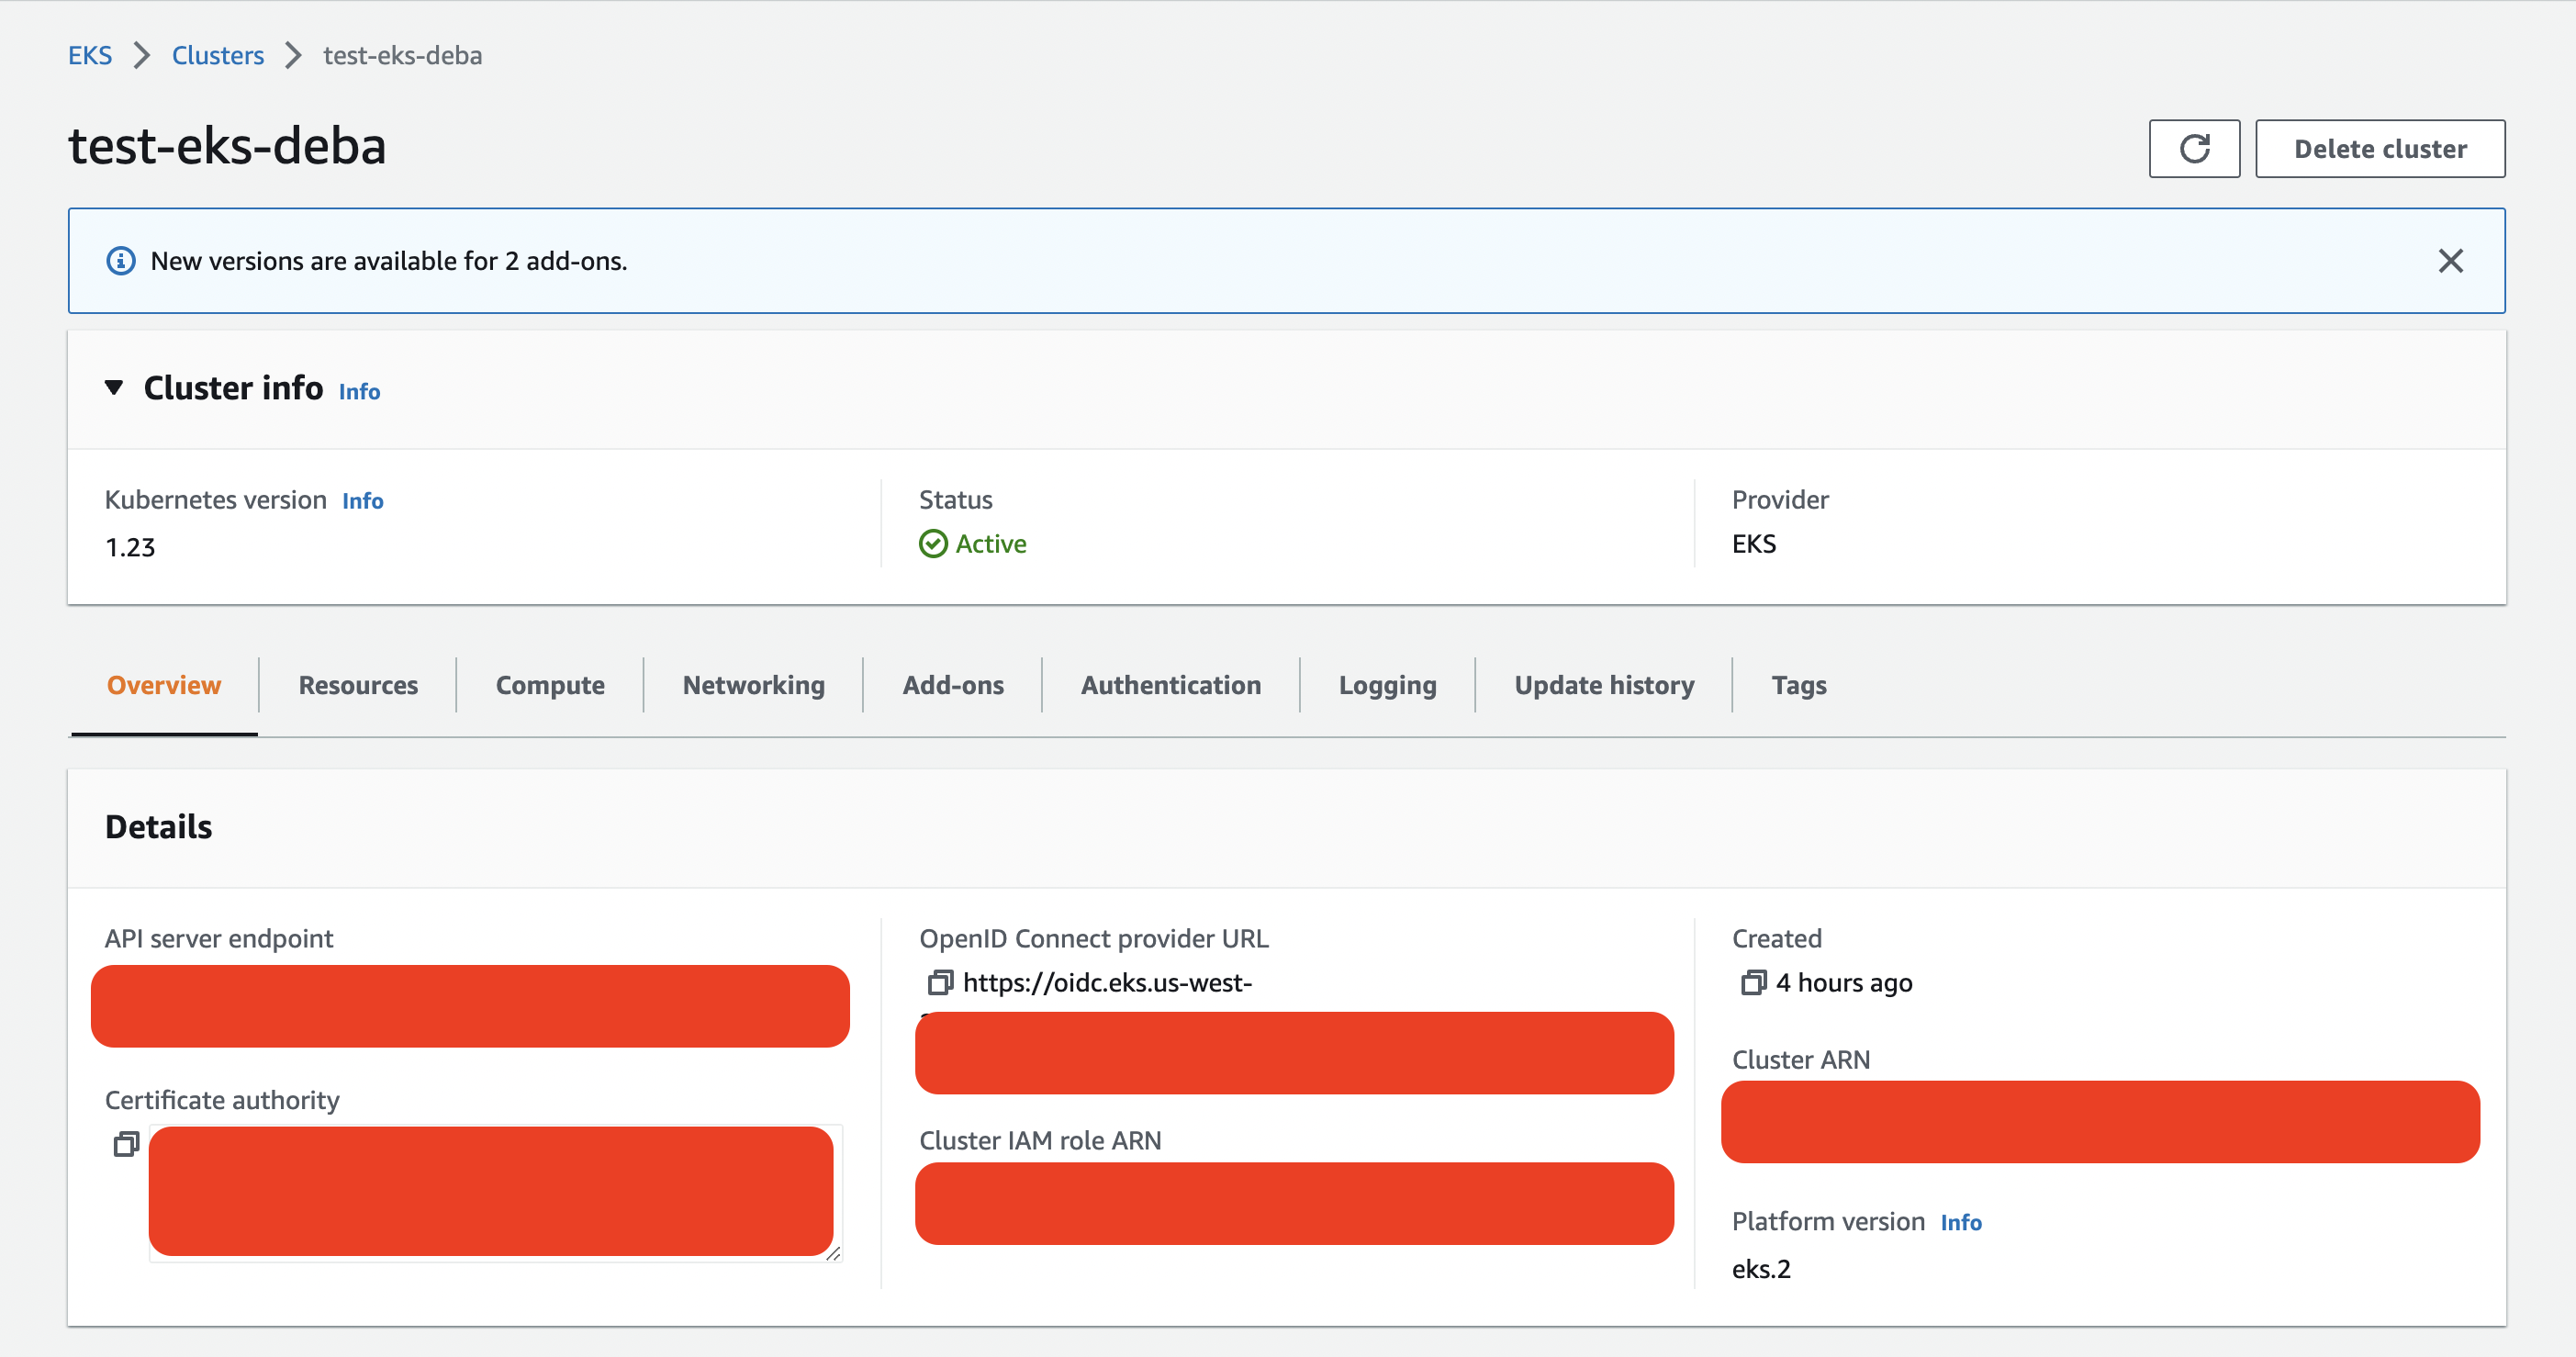
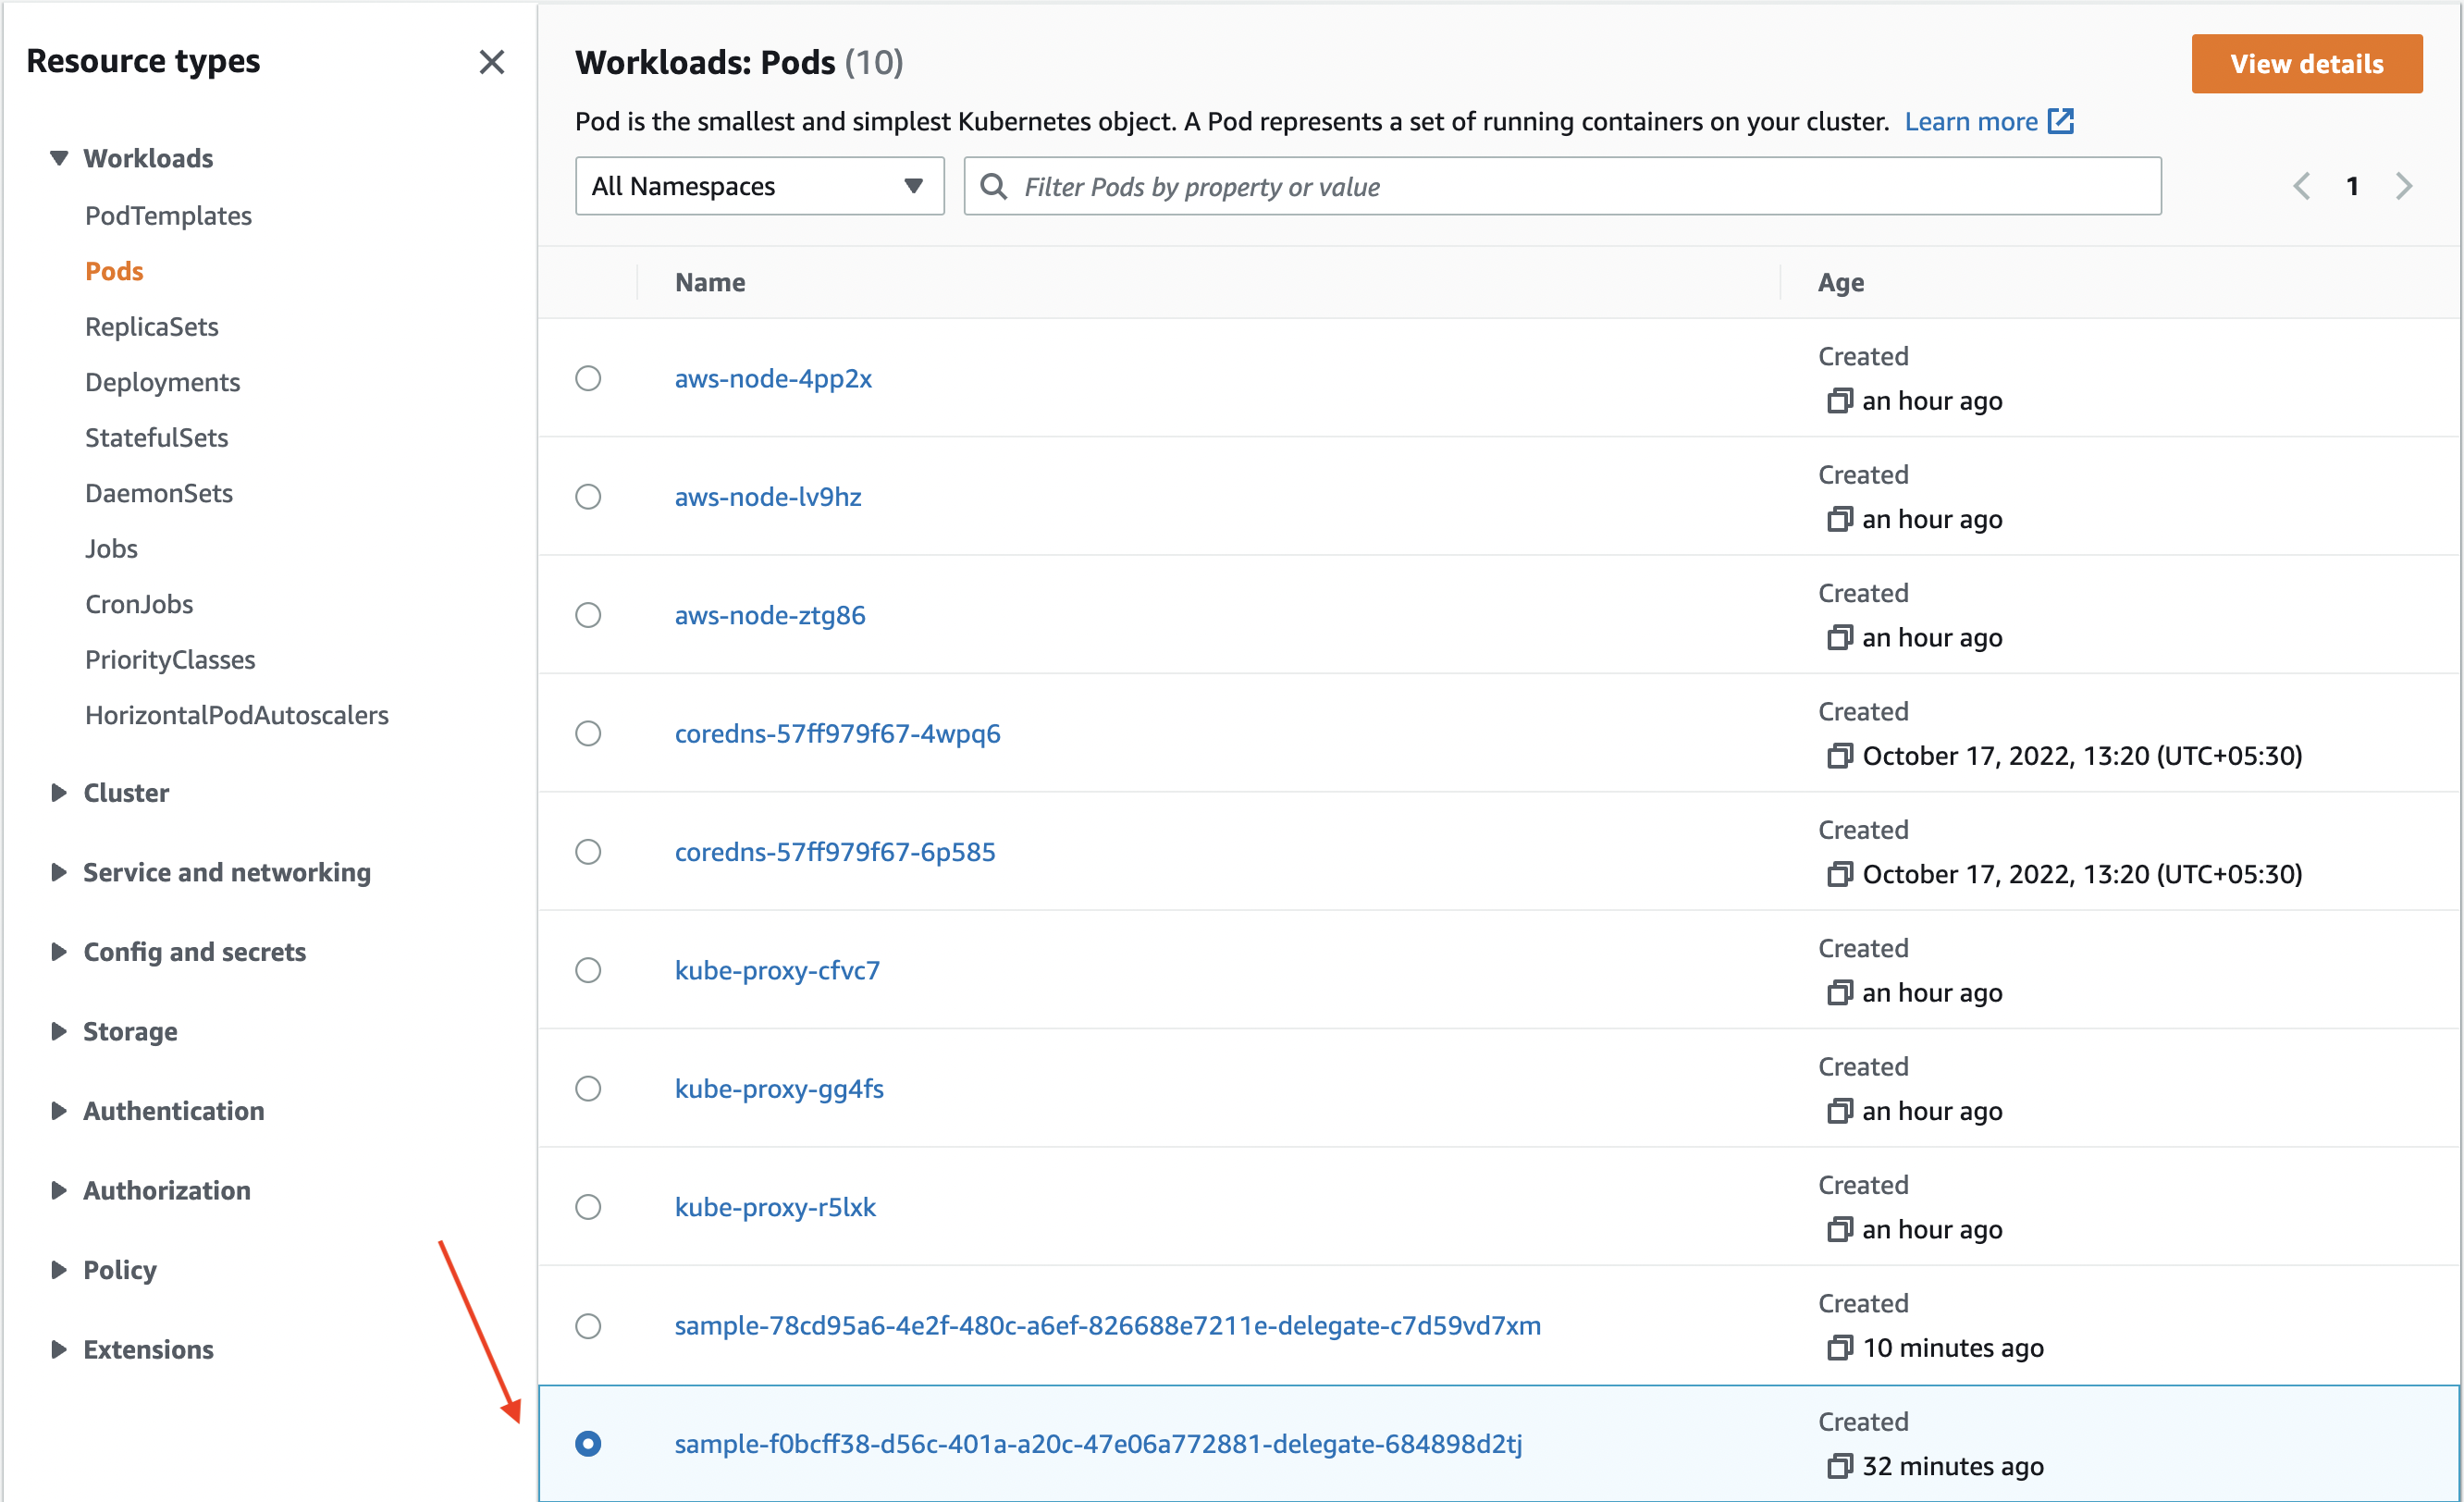
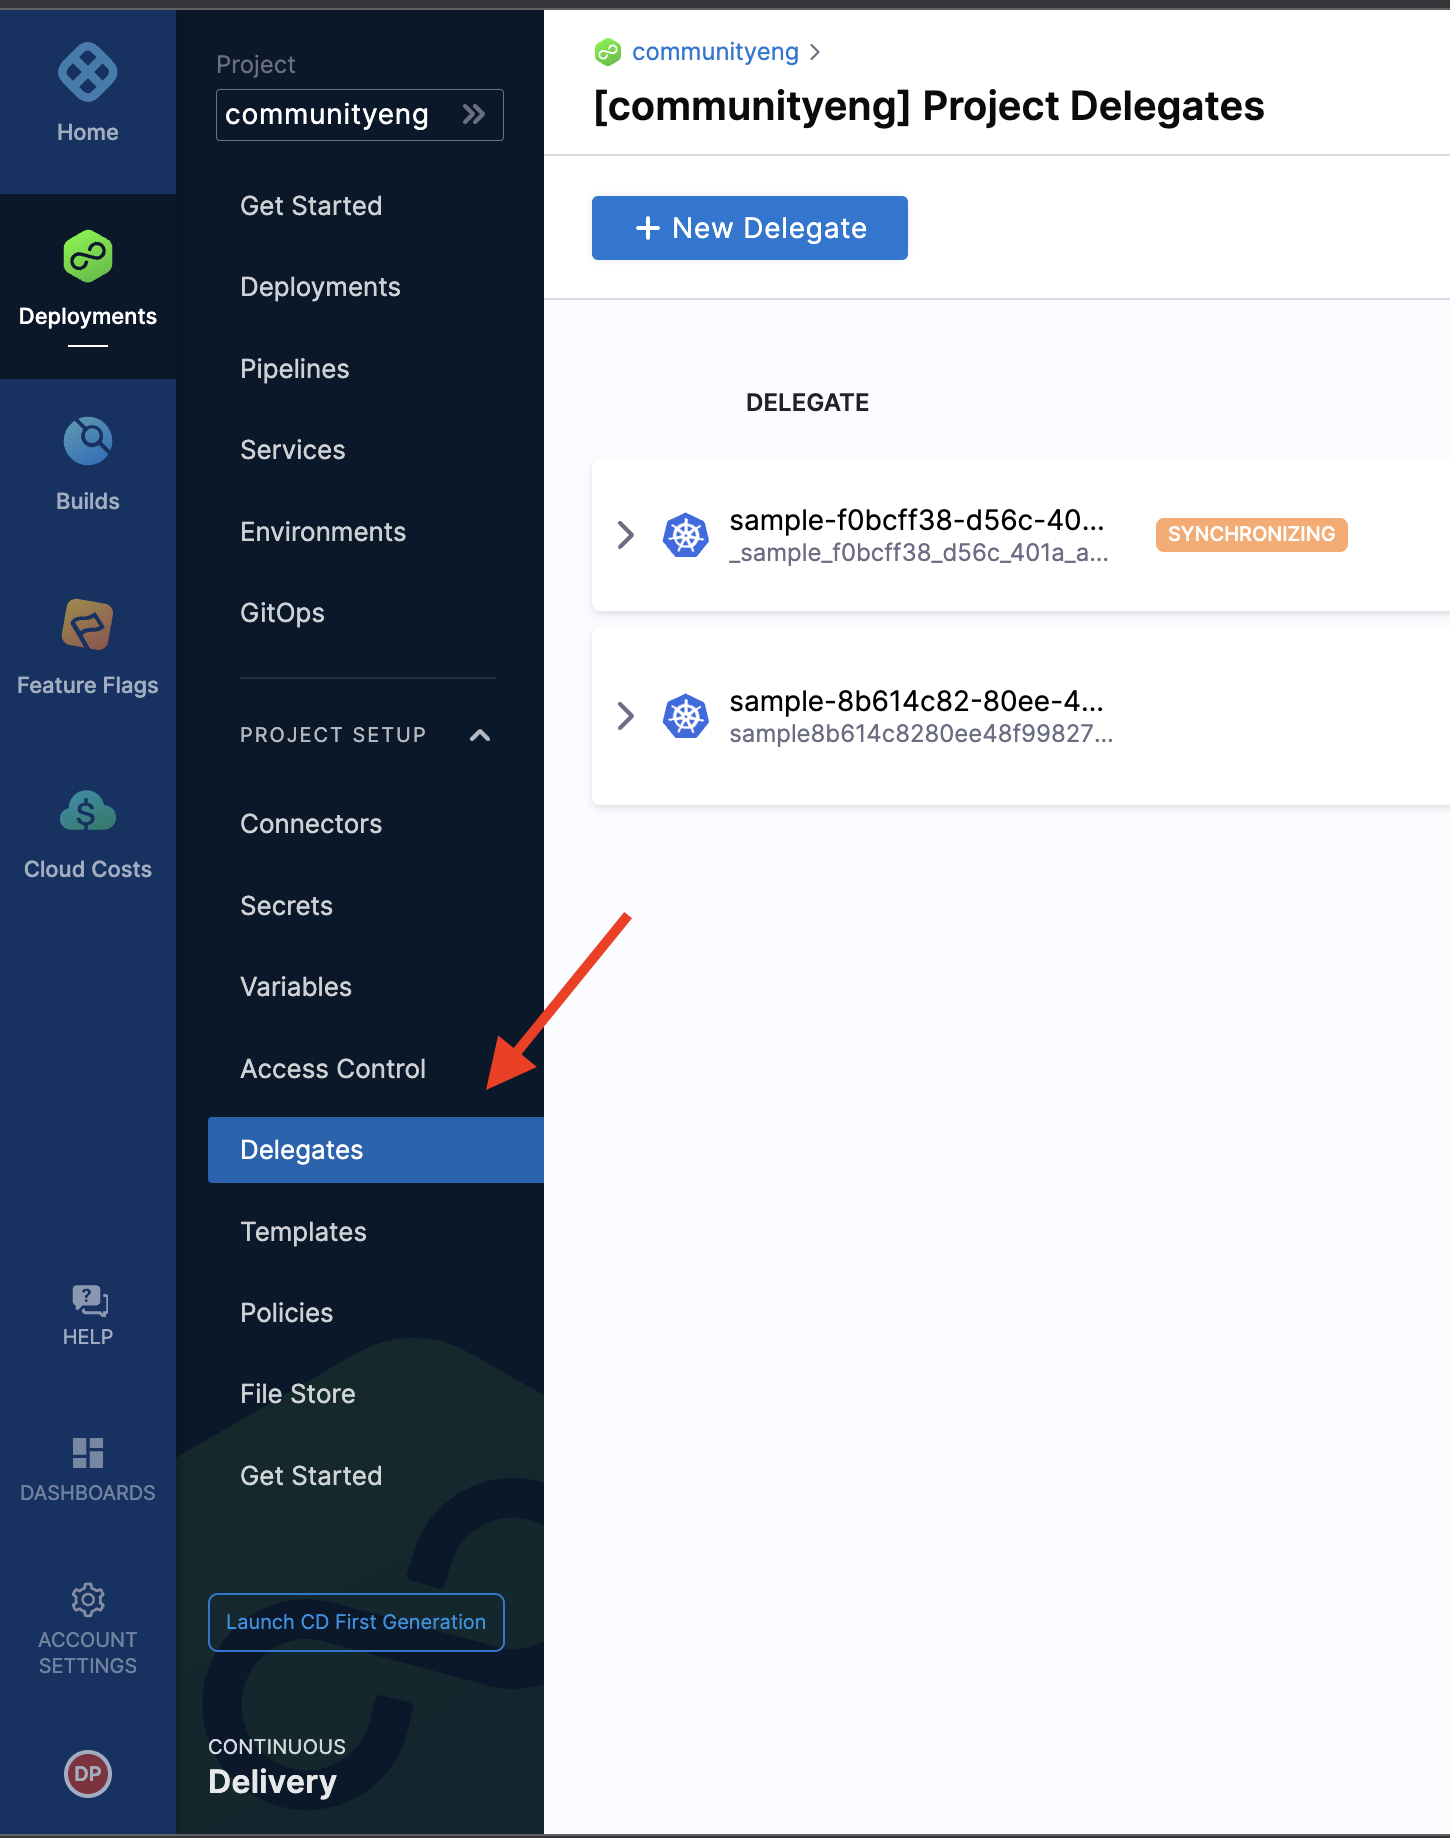
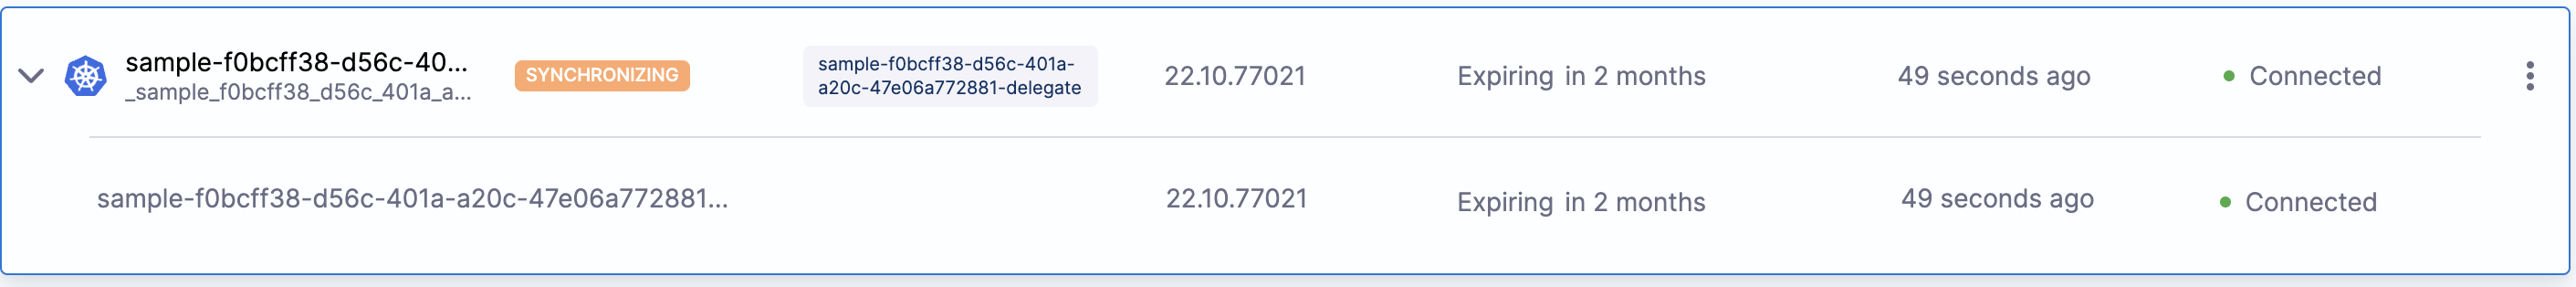
What happens if a user selects a Kubernetes cluster that has an INACTIVE delegate?
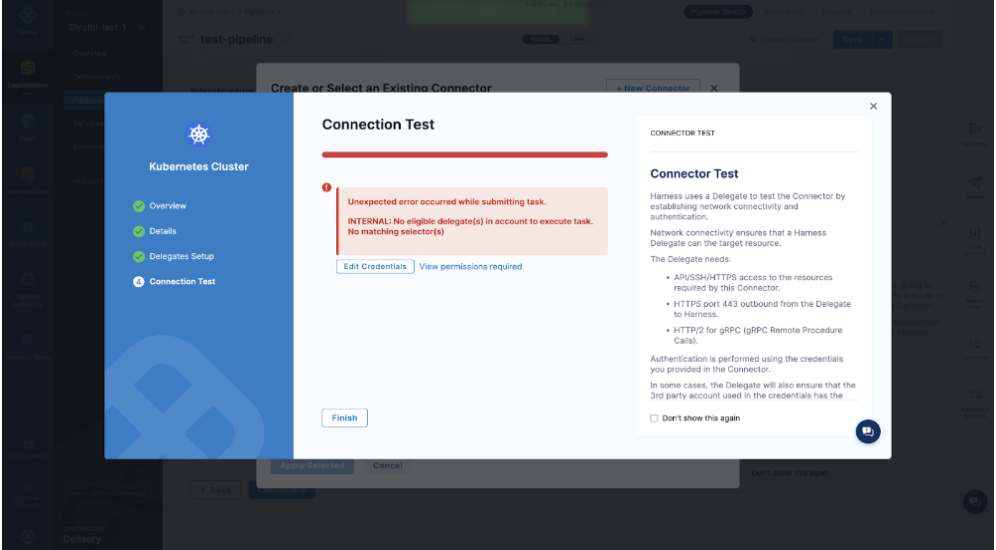
Solution:
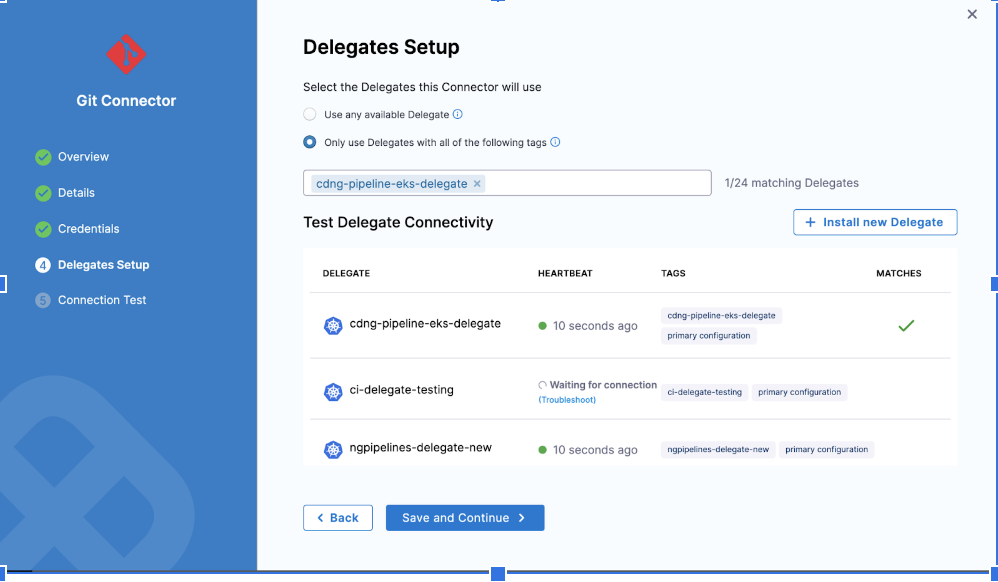 As per the screenshot above, make sure you verify the delegate if it is CONNECTED and you select the one that is active with ‘heartbeat’.
Issue:
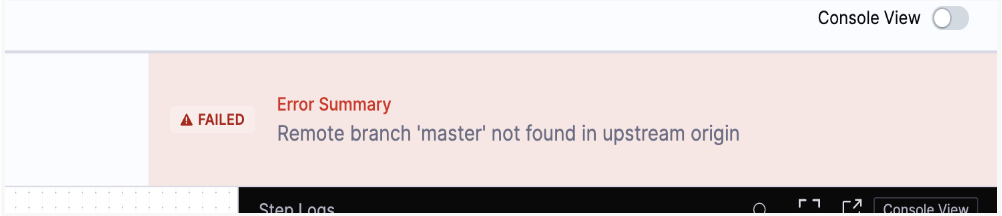
Solution:
Check the git connector. Make sure the branch mentioned is available on the remote system.
Issue:
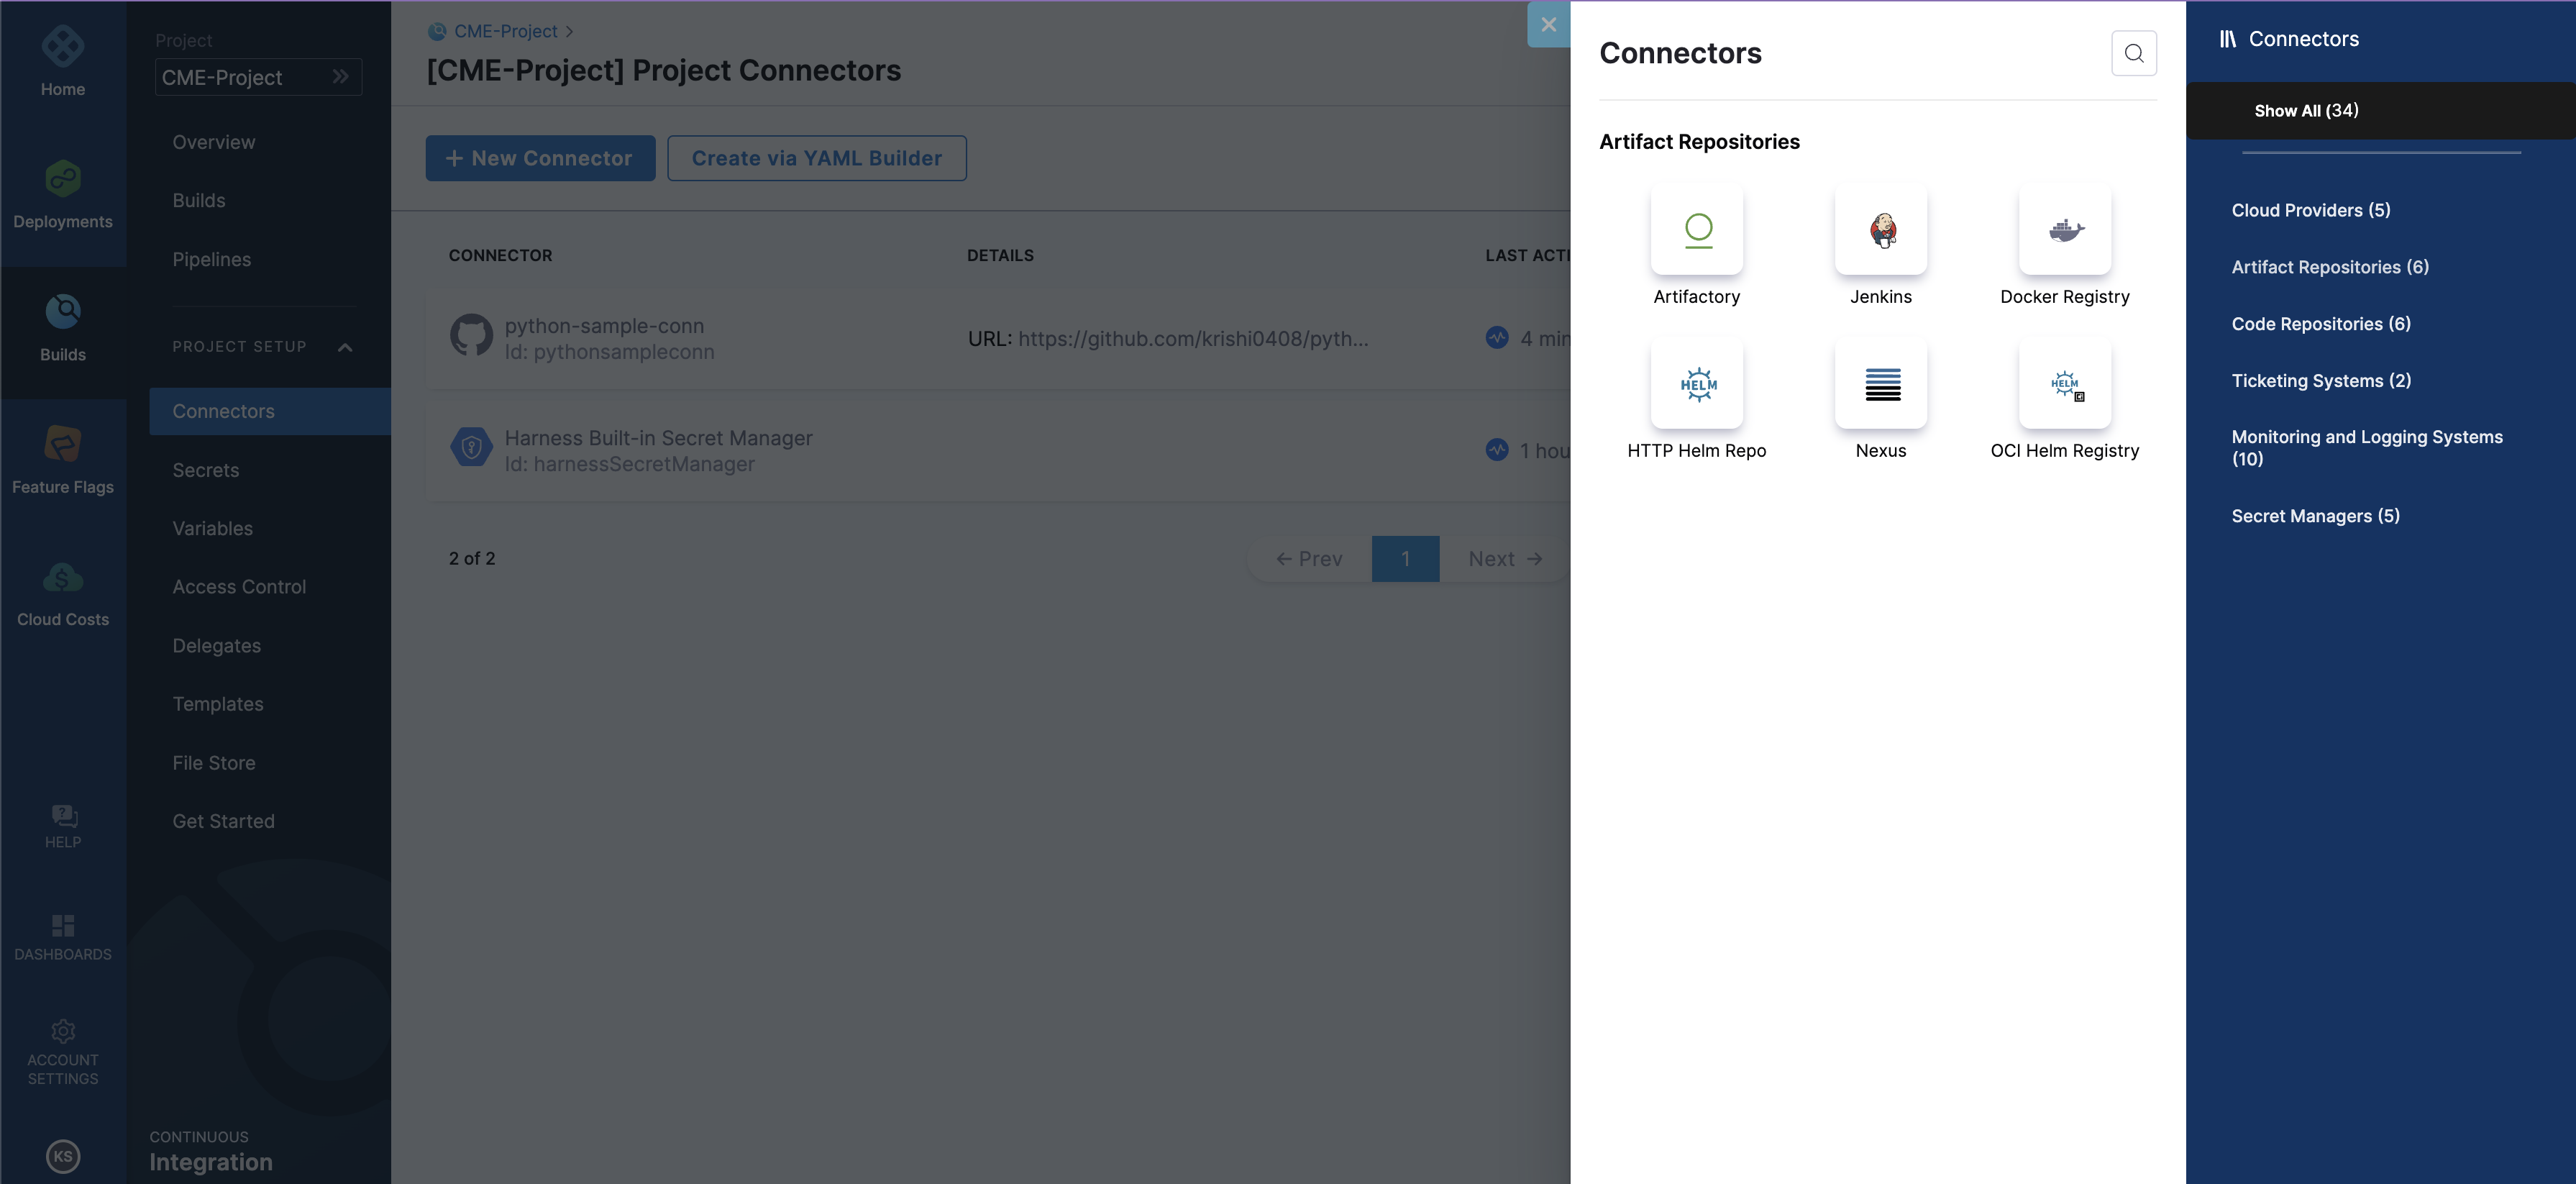
Hi, I provisioned a Helm Connector as the Connector Artifact Server. I would like to get the details of the connector via Harness SDK. I am aware of the GitHub repo, however, I cannot find the exact function I need to use, etc. Kindly help.
Solution:
If you want to get Harness configurations or automate the creation of resources you can use the REST APIs.
Issue:
Example for a connector in Harness SDK
Solution:
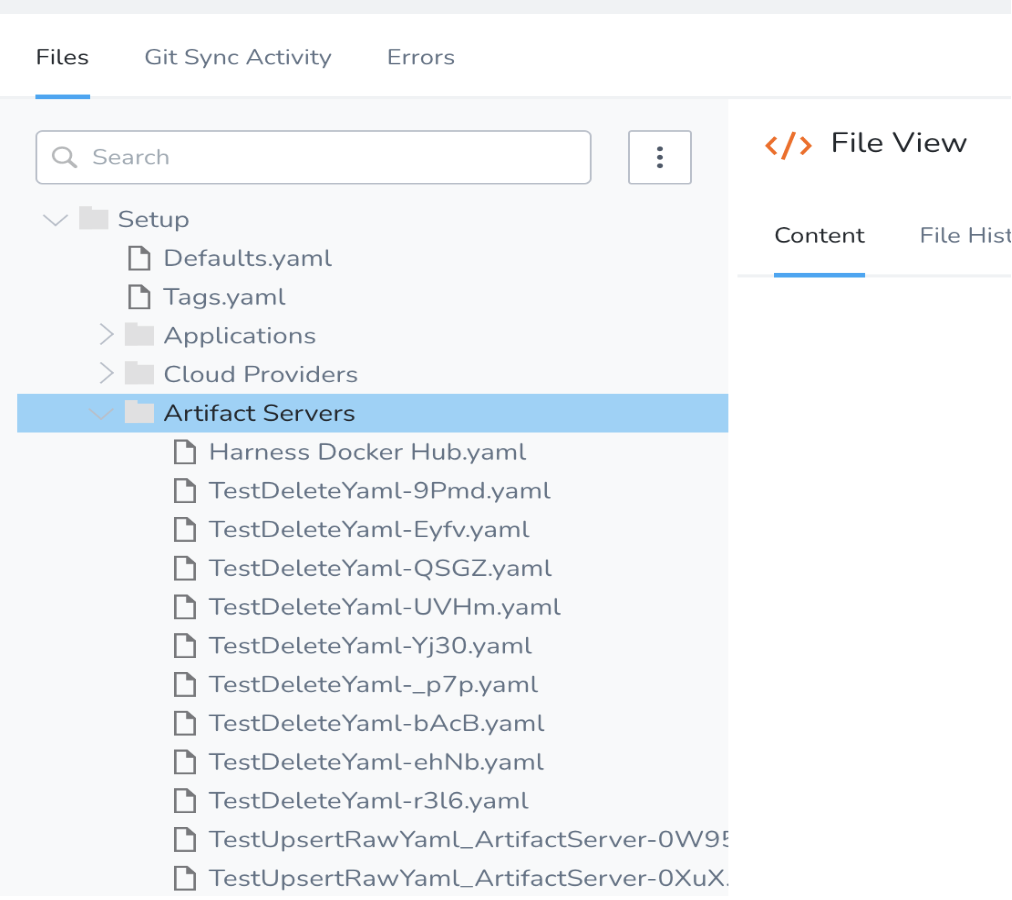
Currently, the SDK doesn't have native support for connector resources but it can still be fetched using the config-as-code APIs. If you know the path to the connector you can do something like this. If you already have a connector created you can find the path by going to Setup -> Config As Code (located in the top right-hand corner). From here you'll be able to see the path to where the connector's YAML configuration. For example, the path would be something like: Setup/Artifact Servers/Harness Docker Hub.yaml. I have attached a screenshot of it to look at.
Using the method I linked to, you'll be able to get back this YAML. There's not yet a native object in the SDK that you can easily parse this into, but you can create one yourself and deserialize it. Let me know if that helps in any way. (Screenshot attached for reference)
MANIFEST FILES
Issue:
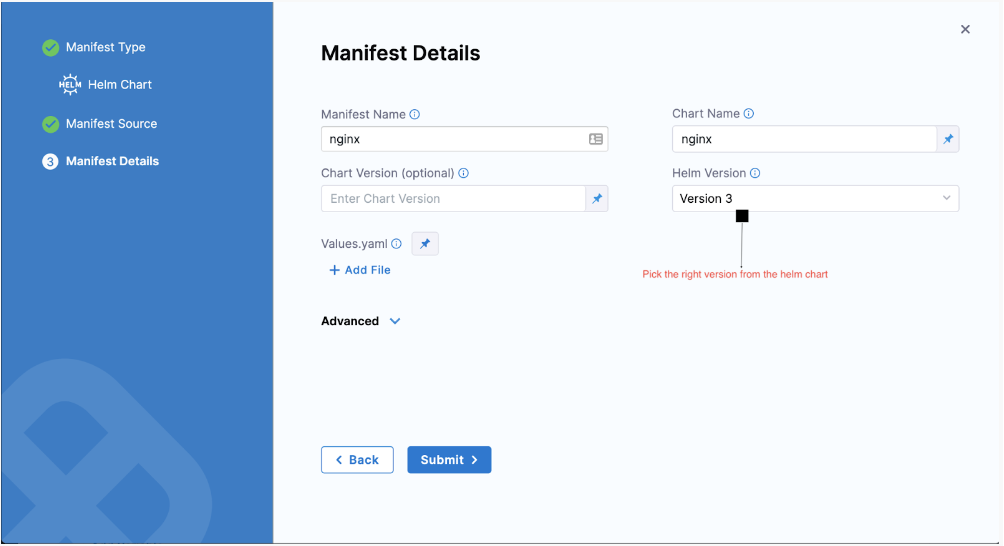
What happens if a user is trying to make a deployment using helm chart inputs wrong chart version?
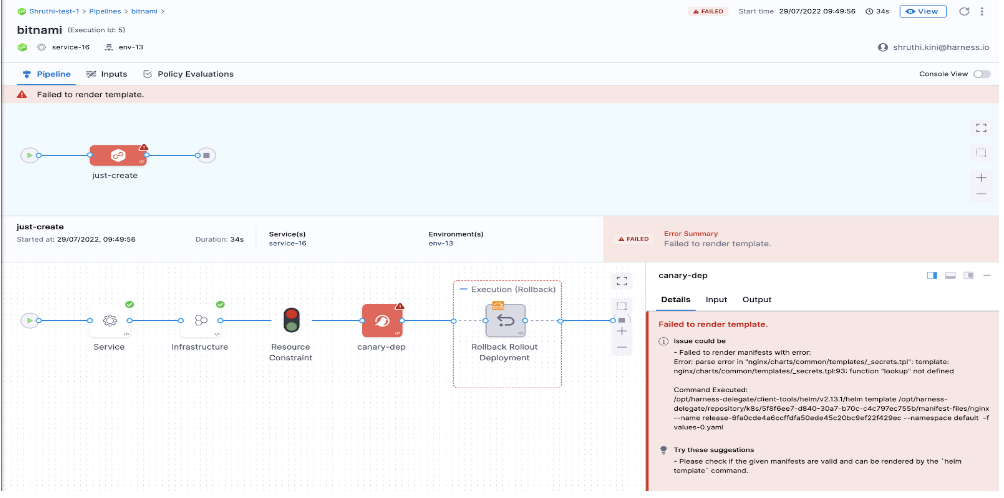
Solution:
Check the chart version while adding them to the manifest step in the pipeline stage.
ARTIFACTS
Issue:
When I try to run the pipeline, if I select the “tags” dropdown to add a tag to the execution, I get the following error:
Stage Deploy_Dev: Please make sure that your delegates are connected. Refer [docs](https://ngdocs.harness.io/article/re8kk0ex4k) for more information on delegate Installation.
Solution:
If you are using docker to pick your artifacts, then make sure you are defining the right path. Right URL: https://registry.hub.docker.com/. You can define tags by providing inputs at runtime or define them in your YAML file ex: tag: “latest”.
ENVIRONMENT
Issue:
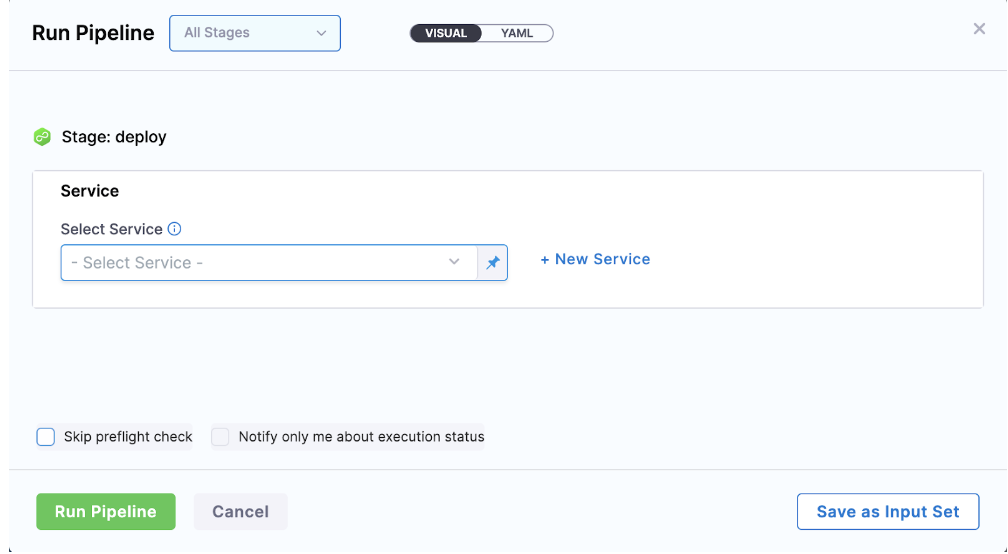
Multiple options are available for the user to set the SERVICE
- If the user wants to set a fixed value:
Solution:
- If the user wants to pass it at runtime:
Solution:
DEPLOYMENT STRATEGY
Issue:
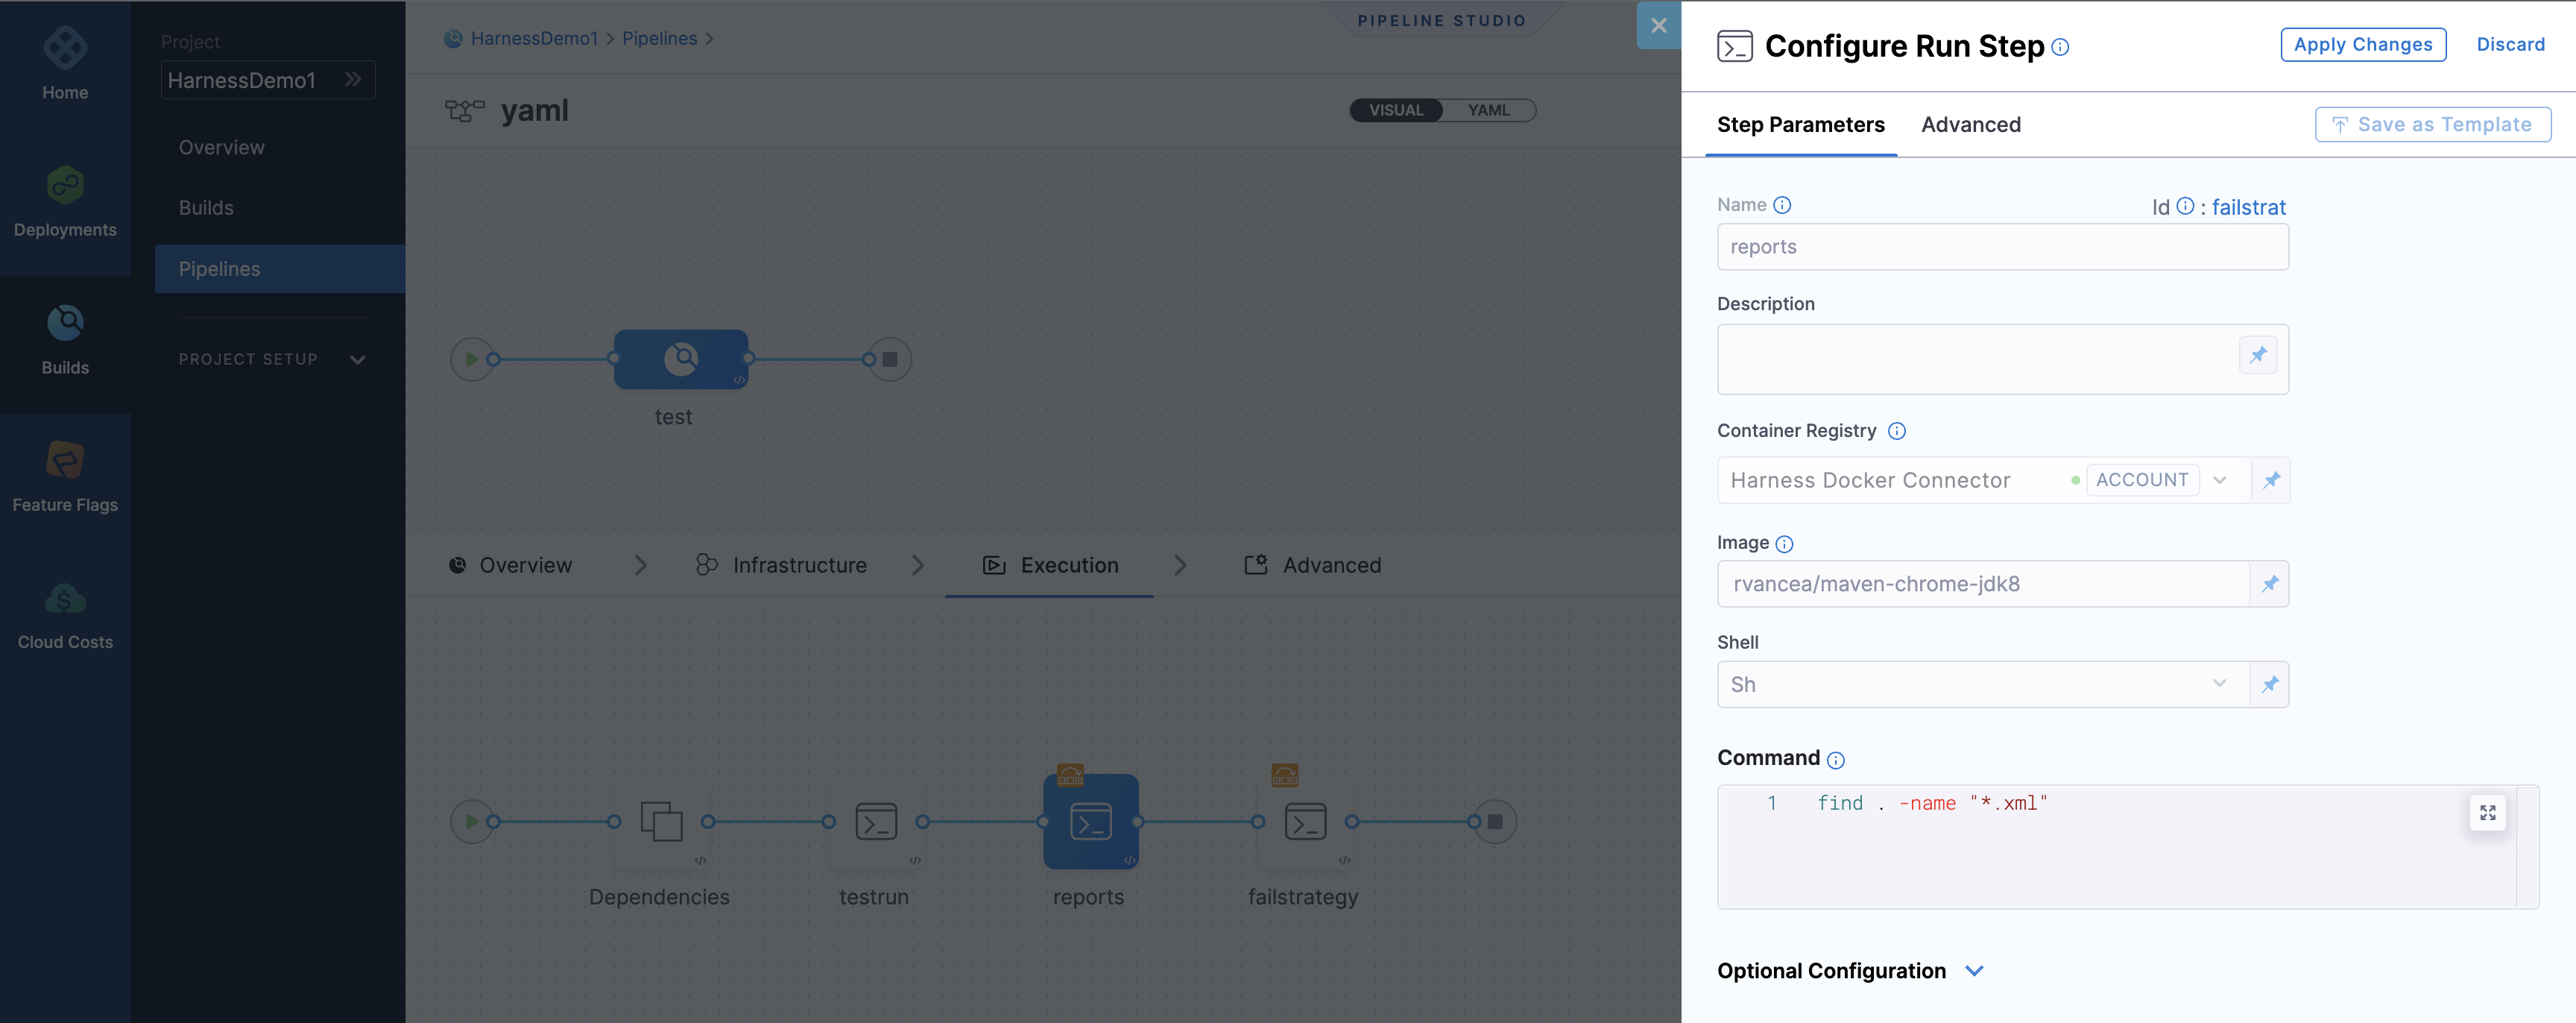
What if the user selects a step irrelevant to the deployment strategy?
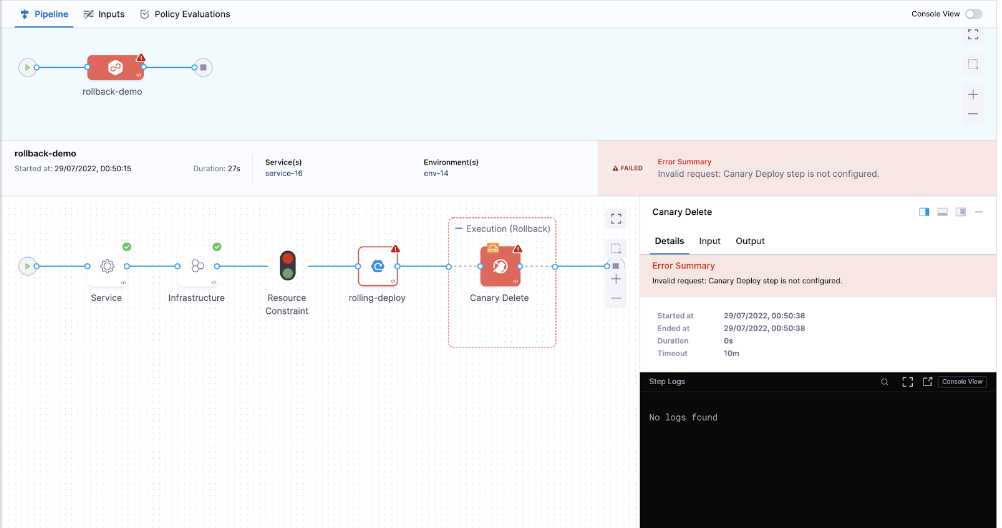
Solution:
Make sure you select this step based on the deployment strategy selected. Say if you select a canary deployment, you have a canary delete step to delete the workloads and for other deployments, we have a delete step for cleaning.
Possible errors at the time of deployment
Issue:
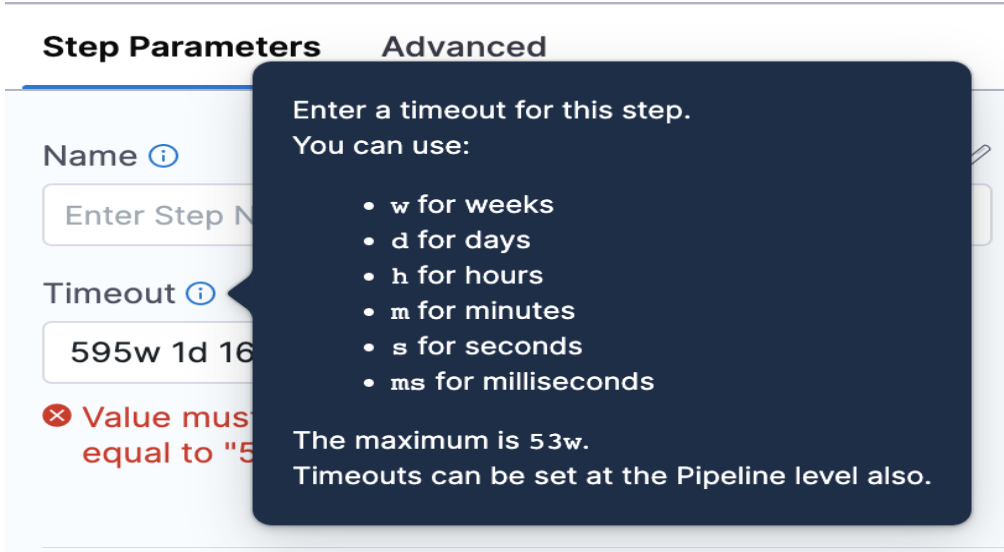
What happens if the user inputs an invalid timeout for a step in a pipeline stage?
Solution:
Follow the tooltip
Issue:
When you enable editing mode and then try to navigate from YAML
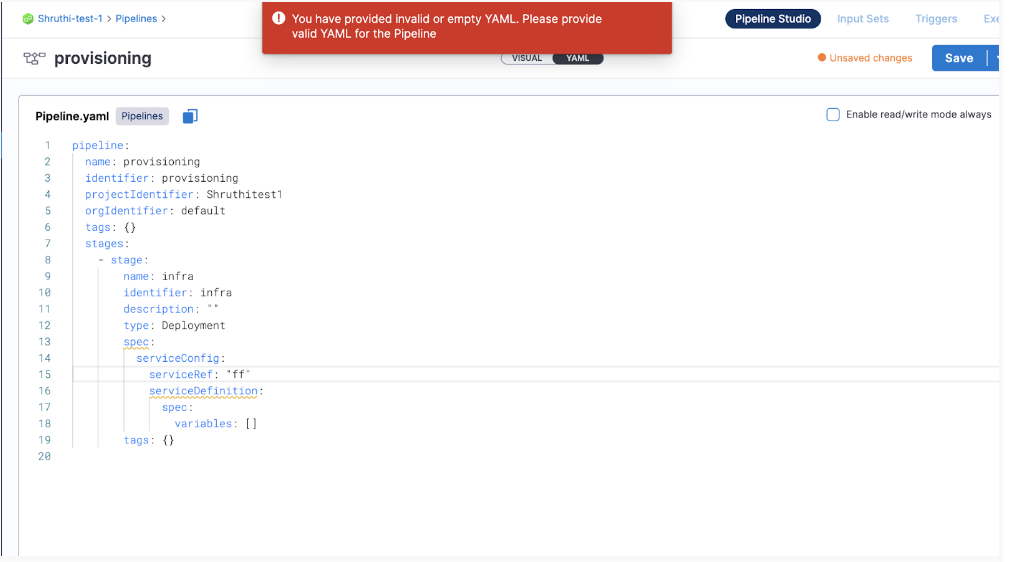
Solution:
Make sure you complete all the steps in the stage. Incomplete Yaml will not be allowed to navigate or move further.
DELEGATE
Issue:
Does the Harness delegate running in Kubernetes support node architecture using ARM64?
Solution:
- We are not providing the binaries for the client tools in arm64, you would need to build your custom docker image to already have the arm64 binaries in client tools, under the same path we expect. Then we would see they are already there and not overwrite them.
- To use arm64 would need to reverse engineer our docker image: create your own docker image that installs an arm64 JRE to run the Harness delegate jar and then pre-populate the client-tools directory with arm64 versions of the expected binary.s
The following binary list can be used:
kubectl/v1.13.2/kubectl
go-template/v0.4/go-template
harness-pywinrm/v0.4-dev/harness-pywinrm
helm/v2.13.1/helm
helm/v3.1.2/helm
helm/v3.8.0/helm
chartmuseum/v0.12.0/chartmuseum
chartmuseum/v0.8.2/chartmuseum
tf-config-inspect/v1.0/terraform-config-inspect
tf-config-inspect/v1.1/terraform-config-inspect
oc/v4.2.16/oc
kustomize/v3.5.4/kustomize
kustomize/v4.0.0/kustomizen
scm/36d92fd8/scm
Note: We will be launching arm64 in couple of weeks
Issue:
The user wants to provision target infrastructure using terraform on Azure and deploy a sample app in it. The build pipeline executes but the deploy stage fails.
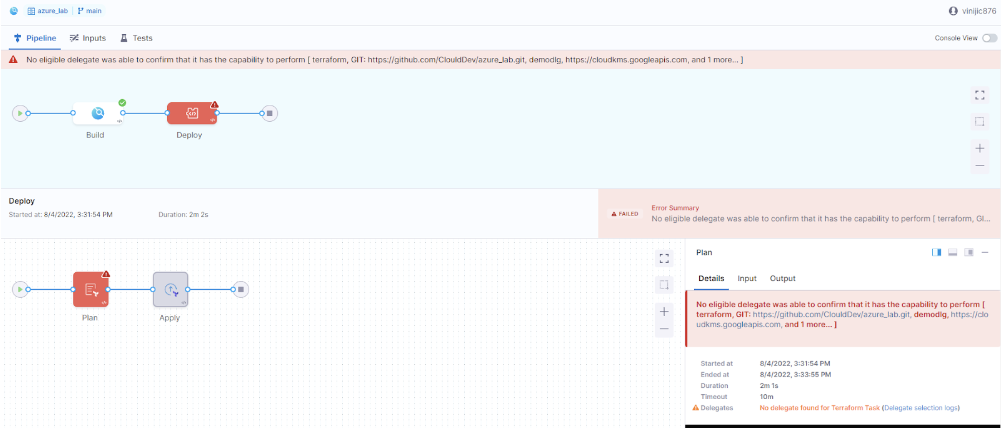
Solution:
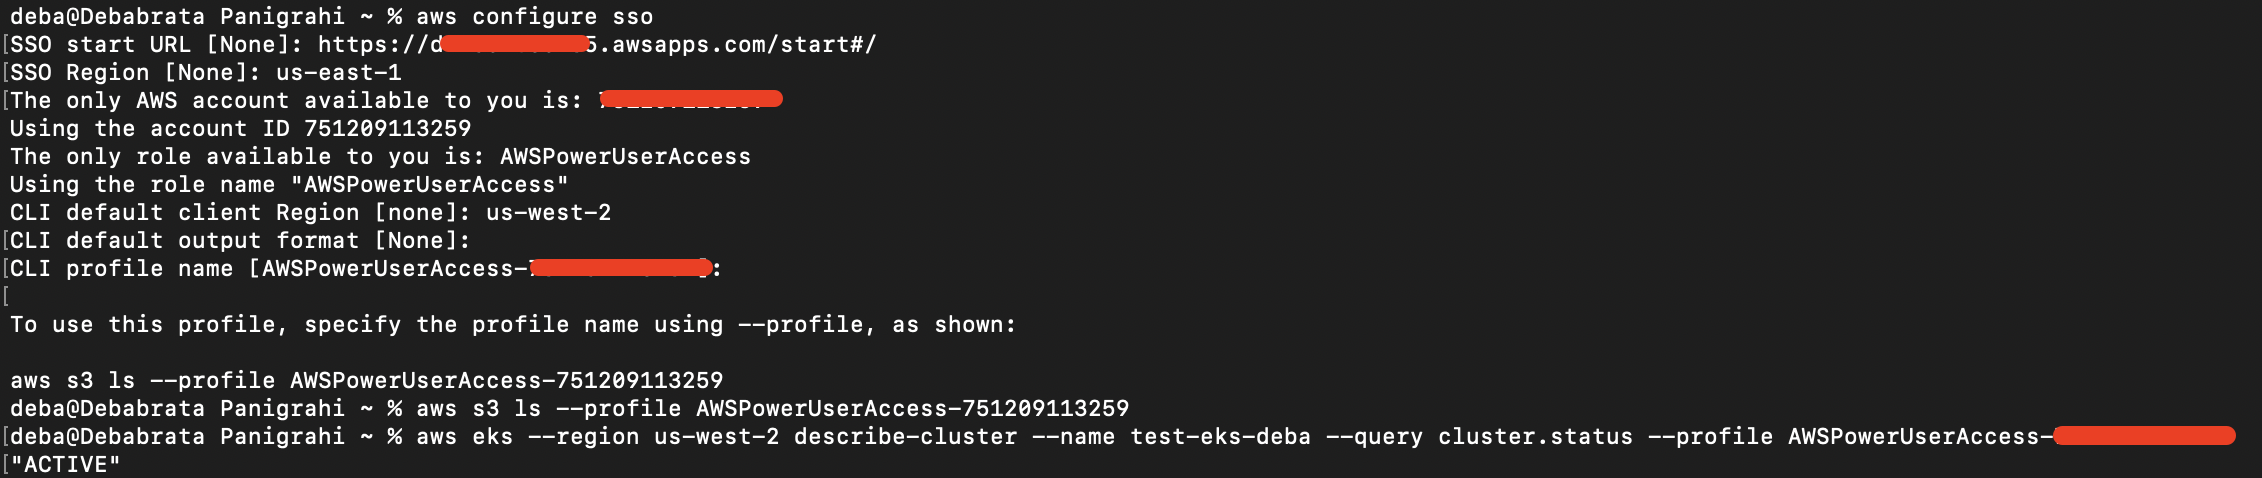
- Check if the delegate is ACTIVE and has enough resources assigned to the pod. You can check the pods state with the commands like:
kubectl get pods -n <<namespace>>
kubectl describe pods -n <<namespace>>
For delegate capability issues, it depends on the specific user’s use case. Ex: if you want to do a terraform deployment, a few versions of terraform demand, terraform to be installed on the delegate pod. If you want to do a helm deployment using Helm V2, you will need to install Helm v2 and Tiller on the delegate pod.
Please review our docs on supported integrations.
TEMPLATE
Issue:
Is there a way to do the equivalent of the helm template command to render the templates and display the output in the Harness?
Solution:
We run a Helm Template when we do a Helm Chart Manifest type with a Kubernetes Deployment Type, we don’t output that to a variable for a user to view, it can only be viewed in our execution logs. We don’t do this either for a Native Helm Deployment where we run a Helm Template and then perform the Helm install or helm upgrade and the output is only visible in the execution log.
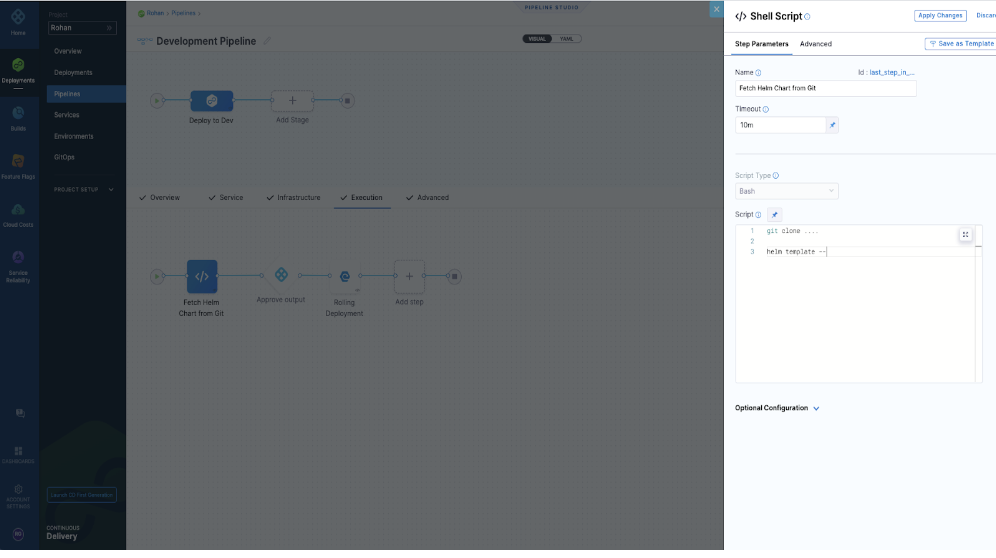
We have seen our users fetch the chart in a shell script step and run the helm commands on the chart to see the output before Harness does a deployment.
Issue:
I am using Harness to spin a short-lived Kubernetes job. Is there any way to fetch the logs back to the Harness?
Solution:
You can write a shell script to fetch logs for you as an output and then you can export/download them as deployment logs.
Issue:
I was referring to this guide in Harness docs to learn about continuous delivery. On running the pipeline this error showed up. Does anyone know why this came and how to resolve it?
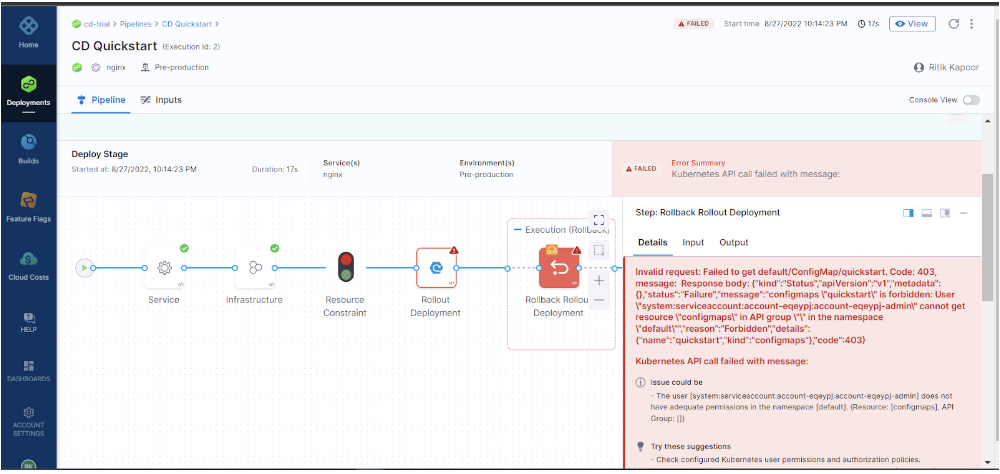
Solution:
Harness uses its own ConfigMap for every deployment to store the release history in a Kubernetes cluster. This ConfigMap can be used for Rollback if the deployment fails.
Let’s say you are at your very first deployment(ConfigMap is yet to be created by Harness), now you want to make an API call to check if ConfigMap exists and say you get this error.
Invalid request: Failed to get ConfigMap. Code: 403, message:{"kind":"Status","apiVersion":"v1","metadata":{},"status":"Failure","message":"configmaps \"release-abcdef\" is forbidden: User \"system:serviceaccount:sa:harness\" cannot get resource \"configmaps\" in API group \"\" in the namespace \"ns\"","reason":"Forbidden","details":{"name":"release-abcdef","kind":"configmaps"},"code":403}
It is clear from the above screenshot that API calls are failing due to permission. Check the permissions and try again and this doc should help.
Issue:
Hi, I am creating a custom service command in Harness that simply deploys a zip file to my host. I realized that if for some reason my artifact does not get deployed correctly and the zip file does not exist on my host, an error will NOT get thrown when the unzip command fails. I tried forcing Harness to throw an error by writing to stderr using.
if [-f "$ARTIFACT_FILE_NAME" ]; then
   unzip "$ARTIFACT_FILE_NAME"
else
   1>&2 echo "Error: cannot find artifact"
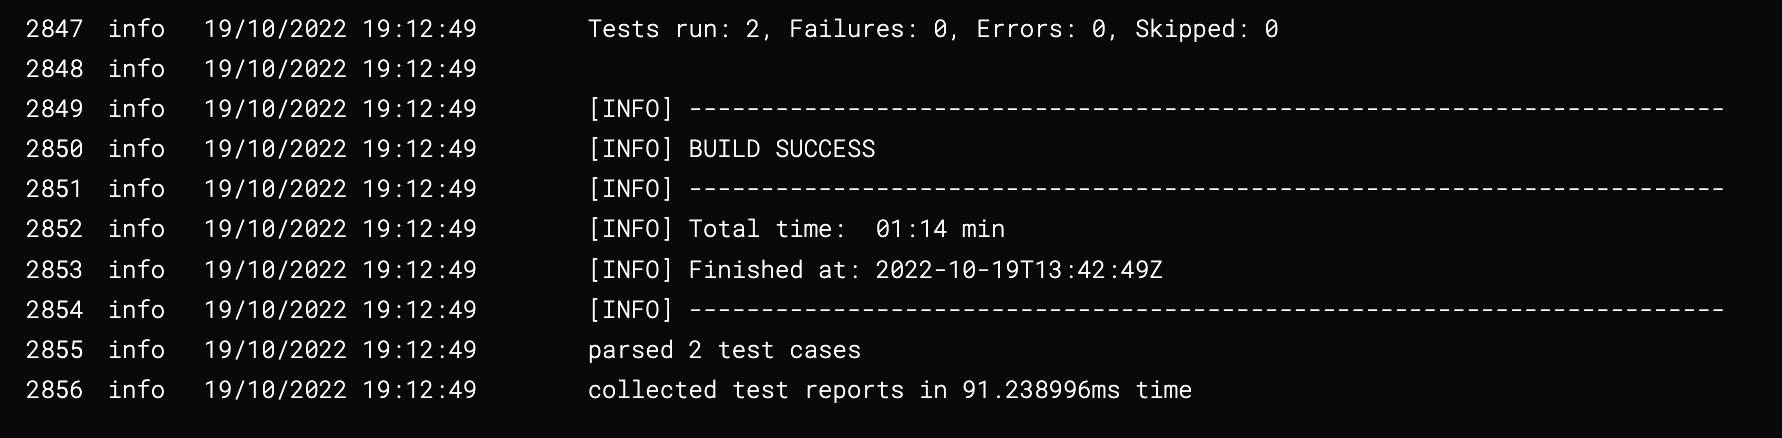
But Harness still treats this as an INFO message in the logs and does not fail the deployment. Any suggestions for how to fail a deployment through my bash script?
Solution:
You can refer to this doc, make sure you set -e works as syntactically the '[-f' part of the script is going to cause a failure.
Issue:
How to pull zip files from artifacts in the cd stage?
Solution:
We don’t support that yet in Next Generation. We only support containerized Kubernetes deployments and native helm deployments in the platform. Please review our docs on supported integrations: Please review our docs on supported integrations.
SECRETS
SSH KEY
Issue:
Error while configuring the Linux server with ssh in Harness.
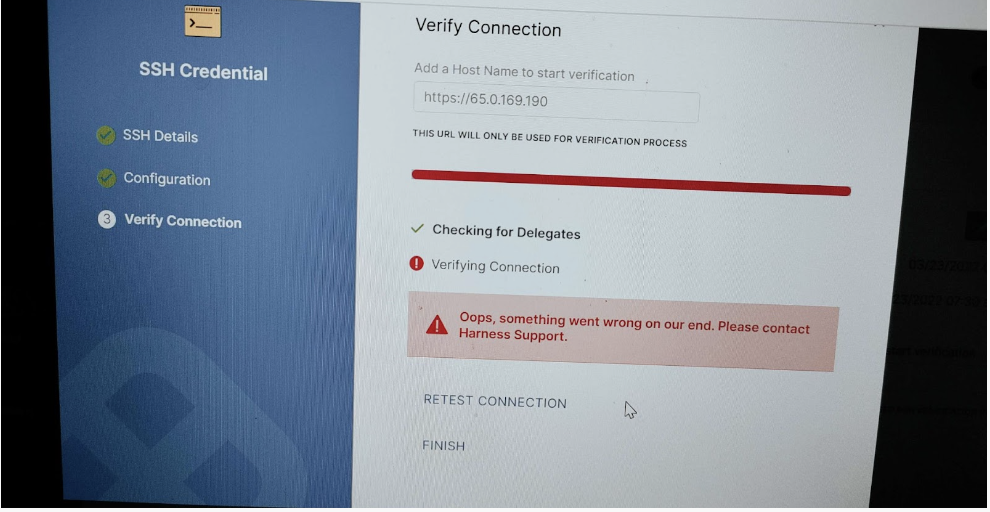
Solution:
- The connection issue likely has something to do with the URL. For an AWS Linux box, it’s usually something like ec2-76-939-110-125.us-west-1.compute.amazonaws.com. For Azure, normally it would be something like ssh -i ~/.ssh/id_rsa azureuser@10.111.12.123 so in Harness try it without the https:// scheme.:
- The SSH key in your screenshot looks like it’s in NextGen. You can also use a Shell Script step in NextGen.
- In Harness CurrentGen you can deploy to any Linux VM using our SSH Deployment Type, you can also use Azure VMSS.
- You can deploy to a physical server.
- If you’re just looking to copy files as part of a 'workflow', you can use a Shell Script step.
- For artifact copy, as opposed to deployment, you can use the SSH Service and Copy Artifact Command.
COMMON ISSUES
Issue:
Hi, need some help with the following questions:
- In Harness cd while deploying helm chart [from an HTTP helm chart], can I upload custom values.yaml file which is at a different location?
- Installed a helm chart on an aks cluster using a Harness but tried to run the helm list locally in my terminal unable to see the release name in the cmd output?
- In Harness CD, can I give a custom release name while installing the helm chart in the pipeline?
Solution:
To answer your question:
- You can do that, refer to the section values.yaml
- By default the app is installed under the Harness namespace so you need to add -n harness to the Helm command. Try:
- Yes, we can do that
Issue:
Can Harness CD deploy a helm chart and support kustomize patch on top of the helm chart? Are helm charts deployed by Harness visible using the helm CLI on the targets?
Solution:
- We can fetch Helm charts for Kustomize Deployments. We can also apply Patches to those kustomize deployments. Harness Agent has its own Helm Client, we use that Helm client to query the deployed resources associated with the chart. With Kustomize and Helm charts, Harness wouldn’t deploy using Helm, we would deploy using the kustomize cli and we can apply patches. We would track the resources with the labels we apply to the Kubernetes objects we deploy.
- You could run a helm list -To list all the helm charts, that’s no problem. However, Harness will manage the state and take care of rollback for you vs the helm client and tiller. We already know what the previous resources are so in event of deployment failure we can roll back to the last known healthy state. We have an Argo CD Integration where we allow you to leverage your existing ArgoCD cluster and manage it with Harness and Integrate it natively with Harness CI.
Harness can use ArgoCD for GitOps
Harness can manage and orchestrate the Deployments out of the box without having ArgoCD cluster management. We manage the deployed resources on the cluster, we have a slew of integrations with Kubernetes, Helm, Kustomize, and Openshift, We give you Canary, Blue-Green, and Rolling Deployment Logic out of the box.
We integrate with ArgoCD if you want that style of deployment with GitOps.
Quick reference doc:
- Harness Argocd GitOps quickstart
- Use kustomize for Kubernetes deployments
Need further help?
Feel free to ask questions at community.harness.io or join community slack to chat with our engineers in product-specific channels like:
#continuous-integration Get support regarding the CI Module of Harness.
#continuous-delivery Get support regarding the CD Module of Harness.