
12 posts tagged with "continuous-integration"

View All Tags

· 6 min read
Krishika Singh

In a recent survey, we saw that developers spend 30-40% of their time writing codes, now the question arises of where the rest of 70-60% of the time goes. It is spent managing features, fixing deployment issues, and reporting to various stakeholders when things go wrong.

There is a common solution to all these use cases i.e Feature Flags.

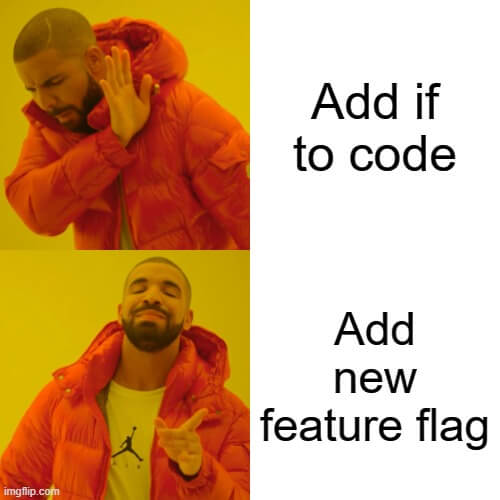
Feature Flags are nothing but conditional statements (think of them as an if-else statement), which is what makes them so adaptable in the ways that they solve many use cases that we are going to discuss further in the blog.

With this, I am going to discuss a few use cases in this blog and will be seeing how a particular use case is without FF and then see how it can be done with Harness Feature Flags.

1. User Targeting

User Targeting allows only subsets of user access to a particular feature. This could be a single customer who has requested a new feature or even it can be used for things like only paying customers will have access to a particular feature.

Without Feature Flags

In order to target users, devs have to stand up some way to recognize a user based on attributes and then build a mechanism to only show them that feature. This can be done using a combination of runtime environment variables and backend database entries. Usually, these requests come from the customer-facing team and sales. For developers to field these request means taking time out to properly understand who target users are, and what attributes define them and then testing the changes performed in the lower level environment to make sure nothing unusual happens and then pushing the code live and sometimes the app or service needs to be restarted again for these changes to take effect.

With Harness Feature Flags

Harness Feature Flag provides the basic user targeting capabilities that product development teams are looking for and additionally lets you automate the process with progressive delivery: roll out to small user groups, verify behavior, manage changes, expand user groups and repeat until you reach 100%.

When you create a Feature Flag in Harness, you will be asked to select the type of flag you want to use, and then you will be prompted to define user attributes that will determine whether the feature will be available to them or not. This targeting can be done in the code via the developer or in the UI by a non-developer and the changes will sync instantly.

2. Testing in Production

One cannot validate a feature unless and until it's live in front of real-time users - something you can not replicate in pre-prod. Without a technique to test in production with real-time users, you might take 3-4x as long to release the feature to the customers.

Without Feature Flag

Without Feature Flags, testing a new feature is the same as deploying a completed feature to production. That is super stressful, especially if you are making a major change like overhauling the UI or migrating to a new database. I am sure you don't want a new ticket telling you that your implementation was wrong and that you need to redo it. You just don't know what is going to actually happen in production and that is a tough reality.

With Harness Feature Flag

How you want to test in production with Harness depends on what kind of feature you are planning to test. There are some common things Harness helps with as you instrument and run your tests.

  • First, you have flag evaluation metrics which will be helpful to see how often a flag is being evaluated, by which sets of target groups, who are making the changes internally, and what changes are being made.

  • Second, If you know you want to test the feature, you can automate the setup of these tests using a pipeline that sequentially setups and runs for a defined amount of time. You can say, you want to test a feature with 10% of users for 2-3 days after getting approval from you, and then roll it out to different 25% of users with slight variation and repeat this until the test is completed.

3. Trunk-Based Deployment

In trunk-based development, each developer divides their work into small batches and merges that into the trunk at least once or several times a day.

Without Feature Flag

Suppose a feature that is being developed takes more than one sprint. There are two options:-

  1. Merge the unfinished code to master making sure nothing breaks.
  2. Let the branch be there for a long and risk the code base changing significantly by the time PR is raised and deal with merge conflicts.

Both of the above two scenarios aren't ideal because they take a significant amount of devs' time for something that isn't core to the job and also a lot of risks are involved if something breaks in the productions side of the house then a lot of rework is needed to once again separate the code.

With Harness Feature Flag

Once a new code is wrapped up inside a feature flag it enters a safe one and won't cause disruptions in the main application and it simplifies both scenarios discussed above.

At its core, Harness Feature Flags by virtue of being used enables trunk-based development. Harness makes it easy by ensuring all releases meet governance standards no matter how small or large is the change. Also, you can set up your own governance guardrails as part of your feature release pipeline to ensure every time the feature is merged into the main trunk and set for release it can be run against a release pipeline to make sure it meets standards and reduce the risk associated. And for the code sitting around for a while, Harness also calls out stale flags so that they can be removed from the system altogether.

Conclusion

Feature Flags for sure is a powerful addition to agile development and give teams more control of their codebase and also end-to-end experience.

So, what you are waiting for visit Harness and try out Harness Feature flags.

You can also visit Harness docs to learn more about Feature Flags as well as learn how you can use them in your applications.

· 3 min read
Krishika Singh

What are Feature Toggles/Feature Flags?

Feature Toggles also called Feature Flags are a powerful technique, that allows teams to modify system behavior without changing the code. It is a set of patterns that can help deliver new functionality to users rapidly but safely. They are great for better control and experimentation of features.

Why Should we use Feature Flags?

  • One should use feature flags as part of their regular development process. Any time you release a feature you should wrap it in a feature flag to test it, control who has access to it and gradually roll it out to the users.

  • One of the biggest challenges the product development team faces is delivering and controlling new features. With continuous delivery and feature flag management, a team can launch and control its features.

  • In Feature flags, you can run canary testing, a technique that allows a team to test a new feature on a subgroup of new users and see how it is performing before rolling the feature out to a wider audience.

  • Feature flags allow you to instantly toggle between different versions of your product. It allows modifying your system behavior without making disruptive code changes.

What are the best practices to adopt while using Feature Flags?

  • Using standardization naming scheme:- People in the organization could start naming the flags with the same name and gettings flags mixed up which could result in activating the wrong flag leading to potential disruptions in your system.

  • Control access to flags:- Set up logging to know which change was made by who, which is important for reducing dependency between the product and engineering team and there will be better productivity a there will be transparency when it comes to making new changes.

  • Conduct regular cleanups for your flags: You need to make sure you are removing flags every now and then which are no longer in use.

Why use Harness Feature Flags?

Harness Feature Flags is made specifically for developers and designed to be fast and easy to use.

Some salient features are:-

  1. Simple UI-Based feature release workflows:- Users have the ability to create templates that they can standardize across feature flags that have the exact operational needs.

  2. Governance and Verification:- Users can ensure production pushes always meet defined organizational standards, and that they can minimize the negative impact of any issues in prod. In addition, users can also automate service verification once a feature is out, ensuring if an issue occurs, the feature is turned off to minimize impact.

  3. Integration into CI/CD/2+2=5:- By presenting the feature flag as a pipeline, feature flag management becomes a natural step in the everyday workflow of development teams and is integrated into CI/CD as a unified pipeline.

  4. Management and Governance: Letting the team build rules and processes and automating cleanups and flag lifecycle management. Ensuring teams can keep their systems secure, compliant, and standardized wherever possible is critical to their goals.

· 3 min read
Debabrata Panigrahi

Introduction

In this tutorial, we will go through a step-by-step example, on how to use the Harness CI for Maven testing.

Pre-Requisite:

Docker Connector to fetch public Docker images of maven chrome jdk8

Let’s now deepdive into the step-by-step tutorial, wherein we will now use the Harness SaaS platform to set-up the maven testing:

Step-1:

Start with the build module, and give it a name test, make sure to keep the clone codebase slider “off” as it is not required in this example.

Step-2:

Now let’s move to the next part of the pipeline, which is to select the infrastructure and select Harness Hosted Builds under the same.

Step-3:

Moving on to the execution step, let’s add a Run Step and name it as “testrun” and under the container registry add the already created Docker Connector, and under the image add the “rvancea/maven-chrome-jdk8”. Now let’s add a shell command to run mvn clean compile -DsuiteXmlFile=Batch1 test and apply the changes.

testrun

Step-4:

Now, let’s add another Run Step similar to the above and name it as reports, just here contrary to the above step the command changes to find . -name "*.xml".

filesgen

Step-5:

It’s time to add the failure strategy now as a Run Step, with the following command.

actualFailedTestsStatus=<+execution.steps.testrun.status>
echo $actualFailedTestsStatus
if [ "$actualFailedTestsStatus" = "IGNORE_FAILED" ]
then
echo "tests have failed"
exit 1
else
echo "Failure reruns have passed"
exit 0
fi

faliurestrat

Step-6:

Now, since the pipeline is complete, let’s save and run the same and the results looks like the following on the console logs.

result

reports

Once the run is successful, the above list of files are generated and can be further stored and processed as the test reports.

For, further reference following is the pipeline yaml of the above mentioned example

pipeline:
name: yaml
identifier: yaml
projectIdentifier: HarnessDemo1
orgIdentifier: default
tags: {}
stages:
- stage:
name: test
identifier: test
type: CI
spec:
cloneCodebase: true
infrastructure:
type: KubernetesHosted
spec:
identifier: k8s-hosted-infra
execution:
steps:
- step:
type: Run
name: testrun
identifier: testrun
spec:
connectorRef: account.harnessImage
image: rvancea/maven-chrome-jdk8
shell: Sh
command: |+
mvn clean compile -DsuiteXmlFile=Batch1 test

privileged: false
reports:
type: JUnit
spec:
paths:
- target/surefire-reports/junitreports/*.xml
failureStrategies:
- onFailure:
errors:
- AllErrors
action:
type: Ignore
- step:
type: Run
name: reports
identifier: failstrat
spec:
connectorRef: account.harnessImage
image: rvancea/maven-chrome-jdk8
shell: Sh
command: find . -name "*.xml"
when:
stageStatus: All
failureStrategies: []
- step:
type: Run
name: failstrategy
identifier: step3
spec:
connectorRef: account.harnessImage
image: rvancea/maven-chrome-jdk8
shell: Sh
command: |-
actualFailedTestsStatus=<+execution.steps.testrun.status>
echo $actualFailedTestsStatus
if [ "$actualFailedTestsStatus" = "IGNORE_FAILED" ]
then
echo "tests have failed"
exit 1
else
echo "Failure reruns have passed"
exit 0
fi
when:
stageStatus: All
failureStrategies: []
properties:
ci:
codebase:
connectorRef: harnessRud
build: <+input>

What’s Next?

The above pipeline and use case was the requirement of one our community user and was built according to their requirements by the community engineering team so, feel free to ask questions at community.harness.io or join community slack to chat with our engineers in product-specific channels like:

· 6 min read
Krishika Singh

In this blog ,we are going to talk about how easily you can set up your pipeline using YAML.

Harness includes visual and YAML editors for creating and editing Pipelines, Triggers, Connectors, and other entities. Everything you can do in the visual editor you can also do in YAML.

For detailed information about using Harness YAML visit Harness YAML Reference and Harness YAML Quickstart.

Before we begin

Make sure you have the following set up before you begin this tutorial:

  • GitHub Account: This tutorial clones a codebase from a Github repo. You will need a GitHub account so Harness can connect to GitHub.
  • Docker Hub account and repo: You will need to push and pull the image you build to Docker Hub. You can use any repo you want, or create a new one for this tutorial.

Getting Started

  • Fork the repository

    For this demo, we are using Python-pipeline-samples.

  • Login into Harness UI

    • Go to Harness.

    • Sign up for the Harness platform.

    • Once you signup you will enter the Harness UI as shown below.

    • Go to Builds and select Create a Project.

      • Give the name of the Project -> `Save and Continue
      • You can also invite collaborators, it's optional.
    • After Save and Continue select the module as `Continous Integration.

      After selecting the module as Continous Integration you will see the screen as shown in the below screenshot.

    • Select Create a Pipeline.

      • Name your Pipeline.
      • Choose the setup as Inline.
      • Select Start. Refer to the below screenshot:

Getting Started

  • After the Creation of the Pipeline, you will enter the pipeline studio as shown below
  • As you can see in the pipeline studio we have two options, one is VISUAL and the other is YAML. Navigate to the YAML editor, as shown below.
  • Copy and Paste the below YAML file into the editor.

Note:- Paste the below YAML file just below the tags{}.

  properties:
ci:
codebase:
connectorRef: <+input>
build: <+input>
depth: <+input>
prCloneStrategy: <+input>
stages:
- stage:
name: build test and run
identifier: build_test_and_run
type: CI
spec:
cloneCodebase: true
infrastructure:
type: KubernetesHosted
spec:
identifier: k8s-hosted-infra
execution:
steps:
- step:
type: Run
name: Code compile
identifier: Code_compile
spec:
connectorRef: <+input>
image: python:3.10.6-alpine
shell: Sh
command: python -m compileall ./
- step:
type: Run
name: Create dockerfile
identifier: Create_dockerfile
spec:
connectorRef: <+input>
image: alpine
shell: Sh
command: |-
touch pythondockerfile
cat > pythondockerfile <<- EOM
FROM python:3.10.6-alpine
WORKDIR /python-pipeline-sample
ADD . /python-pipeline-sample
RUN pip install -r requirements.txt
CMD ["python3" , "./app.py"]
EOM
cat python-docker file
- step:
type: BuildAndPushDockerRegistry
name: Build and Push an image to the docker registry
identifier: Build_and_Push_an_image_to_docker_registry
spec:
connectorRef: <+input>
repo: <+input>
tags:
- latest
dockerfile: pythondockerfile
optimize: true
variables:
- name: container
type: String
description: ""
value: docker
- stage:
name: Integration test
identifier: Integration_test
type: CI
spec:
cloneCodebase: true
infrastructure:
useFromStage: build_test_and_run
execution:
steps:
- step:
type: Background
name: "python server "
identifier: python_server
spec:
connectorRef: <+input>
image: <+input>
shell: Sh
command: python3 ./app.py
- step:
type: Run
name: "test connection to server "
identifier: test_connection_to_server
spec:
connectorRef: <+input>
image: curlimages/curl:7.73.0
shell: Sh
command: |-
sleep 10
curl localhost:5000

  • Click on Save.

    Navigate to VISUAL and now you can see your two-stage pipeline ready as shown below in the screenshot. That's the beauty of YAML in Harness.

    You can navigate through all the steps in the pipeline and explore the pipeline.

Inputs

Before running the pipeline, let's create a GitHub and Docker connector.

  • GitHub Connector

    Under Project setup select Connectors.

    Click on + New Connector

    Select Code Repositories and Choose Github.

    You can refer to the below screenshot.

    Change the Connector settings as follows:

    1. Overview

      Name: python-sample-connector

      Select Continue.

    2. Details

      URL Type: Repository

      Connection Type: HTTP

      GitHub Repository URL: Paste the link of your forked repository

      Select Continue.

    3. Credentials

      Username: (Your Github Username)

      Personal Access Token: Check out how to create personal access token

      Secret Name: Git-Token

      Secret Value: PAT value generated in Github

      Select Enable API access (recommended)

      Under API Authentication-> Personal Acess Token select the name of the secret created in the previous step.

      Select Continue.

    4. Select Connectivity Mode

      Under Connect to the provider-> Select `Connect through Harness Platform.

      Select `Save and Continue.

    5. Connection Test

      You will see Verification Successful which means your connector is connected successfully to your codebase.

      For reference, you can also check out this video on our Harness Community youtube channel

      To develop more understanding of Connectors [check out the docs here](https://docs.harness.io/category/o1zhrfo8n5-connectors)
  • Create a Docker Connector

    Under Project setup select Connectors.

    Click on + New Connector

    Select Artifacts Repositories and Choose `Docker Registry.

    You can refer to the screenshot below

    Change the settings as follows

    1. Overview Name- docker quickstart

    2. Details

      • Docker registry URL - https://index.docker.io/v1/
      • Provider type - Docker Hub
      • Authentication - `Username and Password
      • Username - Docker hub username
      • Secret Token - Check out how to create docker PAT
    3. Select Connectivity Mode

        Under `Connect to the provider`-> Select `Connect through Harness Platform.

      Select `Save and Continue.

      For your reference you can also check out this video on our Harness Community YouTube channel:

  • Create a Docker Repository

    1. Log in to Docker Hub
    2. Go to Repositories -> Select Create Repositories.
    3. Give a name to your repository and you can choose whether you want you repo to be public or repo.

Run the Pipeline

Navigate back to the Pipeline studio and click on Run.

On Clicking, you will see a page asking for inputs so as to run the pipeline, you can refer to the below screenshot

  1. CI Codebase

    • Connector- Select the Github Connector you created in the previous step.
  2. Stage: build test and run

    Step: Code compile

    • Container Registry- Select the Docker Connector you created in the previous step.

    Step: Create dockerfile

    • Container Registry- Select the Docker Connector.

    Step: Build and Push an image to Docker Registry

    • Docker Connector- Select the Docker Connector.
    • Docker Repository- docker-hub-username/repository-name
  3. Stage: Integration Test

    Execution

    Step: python server

    • Container registry- Select the Docker Connector.
    • Image- docker-hub-username/repository-name

    Step: test connection to the server

    • Container registry- Select the Docker Connector.

Click on Run Pipeline.

It will take around less than 3 mins to execute your Pipeline.

After successful completion and execution of all the steps you will see something similar to this:

This article explained YAML based onboarding process, if you want to try out Harness UI based onboarding do check out this tutorial:-

· 3 min read
Debabrata Panigrahi

This tutorial aims at enabling users to set up a Kubernetes cluster on AWS and will serve as the foundation for your CI/CD pipeline infrastructure. After the infrastructure is ready on a free account, you can proceed to create and install a Delegate.

Credits for AWS

To avail free credits in AWS please follow the following resources:

If you are a student please sign in using AWS Educate

Note: Under the AWS Free tier the EKS service is not available, so it’s suggested to get some free credits and use them for EKS.

Pre-requisites:

There are certain requirements in terms of access and permissions and memory resources for the delegate to function properly.

Creating a Cluster:

Considering you are a first-time user, please consider the following specifications along with the above prerequisites, while creating a cluster:

  • Number of nodes: minimum of 3.
  • Machine type: 4vCPU
  • Memory: 12GB RAM and 6GB Disk Space. 8GB RAM is for the Delegate. The remaining memory is for Kubernetes and containers.
  • Networking: Outbound HTTPS for the Harness connection, and to connect to any container image repo. Allow TCP port 22 for SSH.

For creating a cluster follow the steps mentioned in the documentation, also you can take the help of the demo in the video below.

You will be able to see your cluster, after creation on the management console, like the picture below.

AWS Dashboard

Authenticate to the cluster:

  1. Open a terminal and navigate to where the Delegate file is located.
  2. You will connect to your cluster using the terminal so you can simply run the YAML file on the cluster.

AWS Access

  1. In the same terminal, log into your Kubernetes cluster. In most platforms, you select the cluster, click Connect, and copy the access command.

AWS Configure

  1. Next, install the Harness Delegate using the harness-delegate.yaml file you just downloaded. In the terminal connected to your cluster, run this command:

    kubectl apply -f harness-delegate.yml
  2. The successful output would look like this

delegate-install

  1. To validate run the following command and check.

    # kubectl get namespaces
    NAME STATUS AGE
    default Active 29h
    harness-delegate-ng Active 24m
    kube-node-lease Active 29h
    kube-public Active 29h
    kube-system Active 29h

Also, you could check for pods under your AWS cluster to find the delegate

delegate pods

  1. Now that your cluster is operational, you may add resources to it by using the kubectl utility, as you can see. Please use Start Deploying in 5 Minutes with a Delegate-first Approach tutorial to install Delegate at this time and move forward with creating your CI/CD pipeline.

Warning: You have to exit the present pipeline without saving to view delegate details/continue with further steps.

  1. You could check about your delegates on the dashboard under Project Setup.

check-delegate

  1. The delegate details would look something similar to this

delegate-available

Note: Apart from the above mentioned way, there are other ways to install delegate on AWS, for eg using EC2.

Need further help?

Feel free to ask questions at community.harness.io or join community slack to chat with our engineers in product-specific channels like:

#continuous-delivery Get support regarding the CD Module of Harness. #continuous-integration Get support regarding the CI Module of Harness.

· 6 min read
Dhrubajyoti Chakraborty

Introduction

This beginner guide aims to help learners learn the configuration management for run steps settings in Harness CI. We will learn about different settings and permissions for the Harness CI Run Tests step which executes one or more tests on a container image.

Before We Begin

Are you confused with terminologies like Container Resources, Image Pull Policy etc while creating & configuring a run step for your CI pipeline? In this article we will discuss a few such terminologies on the Harness CI platform and how you can configure them to set up your run step in the pipeline settings according to your requirements.

Configuration Parameters in a Run Step

  • Name
  • ID
  • Description
  • Container Registry
  • Image
  • Namespaces
  • Build Tool
  • Language
  • Packages
  • Run Only Selected Tests
  • Test Annotations
  • Pre-Command & Post-Command
  • Report Paths & Environment Variables
  • Output variables
  • Image Pull Policy
  • Container Resources

Name

The unique name for the run step. Each run step must have a unique name & it is recommended to use a name which describes the step.

ID

Most of the Harness entities and resources include a unique Id also referred as entity Identifier that's not modifiable once the entity is created. It provides a constant way to refer to an entity and avoid issues that can arise when a name is changed.

Initially Harness automatically generates an identifier for an entity which can be modified when you are creating the entity but not after the entity is saved.

Even if you rename the entity the Identifier remains the same. The automatically generated Identifier is based on the entity name and follows the identifier naming conventions. If an entity name cannot be used because it's already occupied by another entity Harness automatically adds a prefix in the form of -1, -2, etc.

Check out the documentation to know more about Entity Identifier Reference

Description

This is generally a text string describing the run step and it’s working.

Container Registry

Container Registry refers to the Harness Connector for a container registry. This is the container registry for the image Harness will use run build commands on such as DockerHub.

Check out the documentation to know more about Harness Container Image Registry

Image

Image is the name of the Docker image to use when running commands.For example: alpine-node This image name should include the tag and will by default refer to the latest tag if not specified. You can use any docker image from any docker registry including docker images from private registries.

Different container registries has different name formats:

  • Docker Registry: enter the name of the artifact you want to deploy, such as library/tomcat. Wildcards are not supported.
  • GCR: enter the name of the artifact you want to deploy. Images in repos need to reference a path starting with the project ID that the artifact is in, for example: us.gcr.io/playground-243019/quickstart-image:latest.
  • ECR: enter the name of the artifact you want to deploy. Images in repos need to reference a path, for example: 40000005317.dkr.ecr.us-east-1.amazonaws.com/todolist:0.2.

Namespaces (C#)

A comma-separated list of the Namespace prefixes that you want to test.

Build Tool

This is where you select the build automation tool & the source code language to build, such as Java or C#.

Packages

This are the list of source code package prefixes separated by a comma. For example: com.company., io.company.migrations

Run Only Selected Tests

If this option is unchecked, Test Intelligence is disabled and all tests will run.

Test Annotations

This is where you enter the list of test annotations used in unit testing separated by commas. Any method annotated with this will be treated as a test method. The defaults are: org.junit.Test, org.junit.jupiter.api.Test, org.testng.annotations.Test

Pre-Command & Post-Command

In pre-command you enter the commands for setting up the environment before running the tests. For example, printenv prints all or part of the environment.

In post-command you enter the commands used for cleaning up the environment after running the tests. For example, sleep 600 suspends the process for 600 seconds.

Report Paths

This refers to the path to the file(s) that store results in the JUnit XML format. You can enter multiple paths. Glob is supported.

Environment Variables & Output Variables

Environment variables refers to the variables passed to the container as environment variables and used in the Commands.

Output variables expose Environment Variables for use by other steps/stages of the Pipeline. You can reference the output variable of a step using the step ID and the name of the variable in Output Variables.

output-var

Image Pull Policy

This is where you make the choice to set the pull policy for the image.

  • Always: The kubelet queries the container image registry to resolve the name to an image digest every time the kubelet launches a container. If the kubelet encounters an exact digest cached locally, it uses its cached image; otherwise, the kubelet downloads (pulls) the image with the resolved digest, and uses that image to launch the container.

  • If Not Present: The image is pulled only if it isn't already present locally.

  • Never: The kubelet assumes that the image exists locally and doesn't try to pull the image.

Container Resources

The container resources configuration specifies the maximum resources used by the container at runtime.

Limit Memory Maximum memory that the container can use. You can express memory as a plain integer or as a fixed-point number using the suffixes G or M. You can also use the power-of-two equivalents Gi and Mi.

Limit CPU The maximum number of cores that the container can use. CPU limits are measured in cpu units. Fractional requests are allowed: you can specify one hundred millicpu as 0.1 or 100m.

See Resource units in Kubernetes

note

This is not applicable in case you have opted for Hosted by Harness in your Infrastructure settings of the step.

Timeout

This specifies the timeframe until which the step shall execute. Once the timeout is reached the step fails and the Pipeline execution continues.

NOT ABLE TO TROUBLESHOOT THE ENCOUNTERED ERROR

In case the user is unable to troubleshoot the application error or pipeline execution failures the user can log/submit a ticket to Harness Support. To log a ticket follow the process:

  1. Click the Help button in the Harness Manager
  2. Click Submit a Ticket or Send Screenshot
  3. Fill out the pop up form and click Submit Ticket or Send Feedback

· 4 min read
Hrittik Roy

Creating a delegate requires the creation of an infrastructure in which computational tasks can take place. The infrastructure is typically a Kubernetes cluster.

This tutorial shows you how to set up a Kubernetes cluster on Azure and will serve as the foundation for your CI/CD pipeline infrastructure. After the infrastructure is ready on a free account, you can proceed to create and install a Delegate.

Student Account

If you’re a student, you’re in luck as there is Azure for Students where you can sign in with your educational email address to create an account without a credit card to get $100 worth of credits.

These credits can be used to deploy the Kubernetes Cluster and other services if required.

To, get started with the account creation go to Azure for Students.

Step 1: Click on Activate Now

Activate Free Account

Step 2: After signing in with a Microsoft account, enter your educational email address:

Activate Azure for Students

Step 3: Sign in to Azure Portal!

A free Azure Account

For anyone who can verify their identity with a phone number and a credit card, Azure offers a free account with $200 in Azure credit. Once your account has been verified, you can create a Kubernetes cluster in it.

Step 1: Go to the Azure Free Account Page

Step 2: Click on Start free to start the account creation procedure

Azure Free Account

Step 3: Fill in the following fields

Fill Details

Step 4: Once your details are in click on Sign Up after you have accepted the terms and conditions.

Sign Up Credit Card

Step 5: Verify your phone number

Step 6: Put in your CC details and depending upon your Region a small amount will be deducted and refunded for verification.

Step 7: You can access your account using the Azure Portal

Azure Portal

Azure portal is the web-based management console for Microsoft Azure. It provides a single, unified view of all your Azure resources, including compute, storage, networking, and security. You can use the Azure portal to deploy and manage your Azure resources and to monitor their health and usage.

Azure Portal

You will use the portal to create your Kubernetes Cluster and connect to it.

Create a Cluster

The steps to create a cluster will be to use the Azure Kubernetes Service which is the managed Kubernetes offering from Azure. The steps are as follows:

Step 1: Click on Create a Resource after signing in

Create a Resource

Step 2: Search Container and then click on Kubernetes Service

Find Kubernetes Service

Step 3: Click on Create

Create Kubernetes Service

Step 4: On the Basics page, configure the following options for a Delegate to Run:

  • Project details:
    • Select an Azure Subscription.
    • Select or create an Azure Resource group, such as DelegateGroup.
  • Cluster details:
    • Enter a Kubernetes cluster name, such as myEnviroment.
    • Select a Region for the AKS cluster
    • Select 99.5% for API server availability for lower cost
  • Go to Scale Method and change it to Manual as your account might not have sufficient compute quota for autoscaling. Next change the Node Count to 2 image

Step 5: Start the resource validation by clicking Review + Create on your portal. Once validated, click Create to begin the process of cluster creation. Wait a few minutes for the cluster to deploy.

Connect to your cluster

Now, when your cluster is ready you can connect to the Azure Cloud Shel on your portal and open the terminal

Cloud Shell

Navigate to your cluster and click on Connect!

Connect to Cluster

Follow the steps displayed on the right panel and then you can connect to your cluster!

Run kubectl cluster-info to display details on your cluster!

Next Steps

Now that your cluster is operational, you may add resources to it by using the kubectl utility, as you can see. Please use Start Deploying in 5 Minutes with a Delegate-first Approach tutorial to install Delegate at this time and move forward with creating your CI/CD pipeline.

Need further help?

Feel free to ask questions at community.harness.io or join community slack to chat with our engineers in product-specific channels like:

· 7 min read
Dhrubajyoti Chakraborty

Introduction

This is a guide to get started with the common use cases for the end users to implement pipeline executions successfully in Harness CI

Harness provides various sources & tools to easily troubleshoot frequently encountered errors to fix pipeline failures. This guide lists some of the common issues faced while implementing and designing pipelines in Harness CI and the possible solutions.

What’ll we be covering here?

  • Syntax Verification
  • Variable Verification
  • Troubleshooting Delegate Installation Errors
  • Troubleshooting Triggers Errors
  • Troubleshooting Git Experience Errors

Verify Syntax

An early-stage error use case is generally incorrect syntax. In such cases, the pipeline returns an invalid YAML syntax message and does not start running in case any syntax error is detected.

Edit pipeline.yaml in the pipeline studio

The pipeline editor in the YAML view is recommended for editing experience (rather than the graphical stage view). Major features in the editor include:

  • Creation of connectors, secrets & pipelines from scratch
  • Realtime schema validation
  • Intellisense & auto-completion
  • Field descriptions & rich inline documentation
  • Free Templates for YAML Samples

This feature helps the developer to validate the existing pipeline’s correctness and helps in quick modification alongside copying of a pipeline as a code.

Verify Variables

A very integral part of troubleshooting errors in Harness CI is to verify the variables present in the pipeline and their values. Major configuration in the pipeline depends on the variables and verifying them becomes the easiest way to reach the root cause and potential solution of the problem.

Visit the variables section on the Harness CI platform. Check if the expected variables and their values match and are implemented at the expected stage for the pipeline.

Delegate Setup Failure

The majority of the encountered errors in Harness CI revolve around delegate setup processes. Make sure you have a complete understanding of how to set up a harness delegate from scratch & understand how the Harness manager and delegate complement each other.

Delegate setup also fails if the SSH key used for deployment to the targeted host is incorrect. This usually happens due to incorrect information about the SSH configuration in the Harness Secrets Management and also if the targeted host is not configured to support SSH connections.

For troubleshooting move to the watcher.log file that provides information about the deleted version.

Delegate fails to establish a connection with the Harness Manager

In case of connection failures for the delegate with the Harness Manager, we can use ping on the delegate host to test the response time for app.harness.io and other URLs are consistent or not. We can use the traceroute to check the network route and verify if there is any case of redirection. To verify if the DNS resolution is working fine we can implement nslookup. We can flush the client's DNS cache (Check for the OS). We can run tests to check for local network errors or NAT license limits. In the case of cloud service providers, we’ll have to ensure that the security groups have outbound traffic allowed on HTTP 443.

No eligible delegate found for the assigned pipeline execution

This error is encountered when the delegate fails to achieve the URL criteria for validation. All delegates in harness are identified by their Harness account ID with some additional factors. For example, in VMs the delegates are identified with the combination of their hostname and IP address thus in case the IP changes the Harness Manager fails to identify the delegate. In the case of K8s and ECS delegates, the IP changes when the pod is rescheduled.

The delegate sends the heartbeat, deployment data & Time series, and log data for continuous verification to the Harness Manager. The credentials used by the Delegate must have the roles and permissions required to perform the task. For example, if the account used for an AWS Cloud Provider does not have the roles required for ECS deployments then it will fail.

For more information visit How does Harness Manager Identify Delegates?

K8s Delegate Deletion Failure

To delete the Harness Delegate from the K8s cluster we’ll have to delete the StateFulSet for the delegate. This ensures that the expected number of pods is running and available. Deletion of the delegate without deletion of the StateFulSet results in a recreation of the pod.

For example, if the delegate name is delegate-sample then we can delete StateFulSet with the command below

$ kubectl delete statefulset -n harness-delegate delegate-sample

Triggers Rejection Failures

This usually happens when the user uses a webhook trigger to execute a pipeline or workflow and the name of the artifact in the cURL command is different from the name of the artifact.

Trigger Rejected. Reason: Artifacts Are Missing for Service Name(S)

This is majorly a result of a bad name for an artifact build version when placed in the cURL command. For example a cURL with build number v1.0.4-RC8:

curl -X POST -H 'content-type: application/json'
--url https://app.harness.io/gateway/api/webhooks/... . .
-d '{"application":"tavXGH . . z7POg","artifacts":[
{"service":"app","buildNumber":"v1.0.4-RC8"}]}'

In case the Harness Service artifacts have a different nomenclature the cURL command will fail to execute. Thus ensuring the webhook cURL command has the correct artifact name becomes very important.

Failure when executed Git Push in Harness

In case of two-way sync between the Git repository and the Harness Application, the push to Harness will result in failure unless the GIT YAML files and the required settings are configured before pushing the app to Harness.

For example, in case we have a predefined infrastructure definition and the required labels or parameters are not filled or filled in incorrectly the push to git is more likely to encounter a failure.

Using the Harness Manager to configure the app at first is the best way to encounter this error. This generally ensures that all the required settings are configured correctly and synced with the git repository.

Triggers: zsh: no matches found

In some of the OS versions specifically in MACOS, the default shell is zsh. The zsh shell requires the cURL command to not use the “?” character or put quotes around the URL.

For example;

curl -X POST -H 'content-type: application/json' --url https://app.harness.io/gateway/api/webhooks/xxx?accountId=xxx -d '{"application":"fCLnFhwsTryU-HEdKDVZ1g","parameters":{"Environment":"K8sv2","test":"foo"}}'

This shall work

curl -X POST -H 'content-type: application/json' --url "https://app.harness.io/gateway/api/webhooks/xxx?accountId=xxx -d '{"application":"fCLnFhwsTryU-HEdKDVZ1g","parameters":{"Environment":"K8sv2","test":"foo"}}'"

User does not have "Deployment: execute" permission

The error User does not have "Deployment: execute" permission reflects back to the user’s Application Permission > Settings does not involve execute. This can be solved by resolving the application permission configuration. The user can easily modify the Harness Configure as Code YAML files for the harness application.

To enable editing of the YAML file make sure the user’s Harness User Groups must have the account permission Manage Applications enabled. Also the Application Permissions Update enabled for specific applications

NOT ABLE TO TROUBLESHOOT THE ENCOUNTERED ERROR

In case the user is unable to troubleshoot the application error or pipeline execution failures the user can log/submit a ticket to Harness Support. To log a ticket follow the process:

  1. Click the Help button in the Harness Manager
  2. Click Submit a Ticket or Send Screenshot
  3. Fill out the pop up form and click Submit Ticket or Send Feedback

· 3 min read
Debabrata Panigrahi

Are you confused with terminologies like Access Token, Access Control, and Personal Access Token while creating connectors? In this article, we will discuss a few such terminologies on the Harness platform, what they mean and what values should be entered against them.

So, in Harness when you are using CI/CD to build or deploy we need access to your source code repository and the enterprise cloud for deployments, and hence encrypted secrets are asked as input. In this blog, I have focused on the common errors faced by beginners while trying to setup GitHub connectors.

To begin with:

  1. Select new connector and from the new connector tab select Github under Code Repositories

    Connector Location

  2. Now it’s time to give a name to your connector, but there’s some entity name convention which you need to follow while naming it. Some common errors observed here are : For ease of understanding across orgs and easy identification, you can also add tags and give an apt description to your connector.

    ![Overview](./overview.png)
  3. It’s time for one of the most confusing steps of the process, giving the exact address for your connector which comes in two levels

    1. Account
    2. Repository

    What’s most intriguing and that first time user’s like me, made a mistake in selecting the connection type, so the suggested method is HTTP for first timers for ease of use and you can fetch this URL for your repository directly from the search bar of your browser or from local clone information available in the repository, which has the following format https://github.com/<account-name> for account URL’s type and https://github.com/<account-name>/<repository-name> for Repository URLs.

    Details

  4. Now, it’s time to add credentials, which are required for the authentication to GitHub repository.

    Credentials

    The value in the username field is the same as your GitHub username, and now the most crucial step of adding credentials, is adding the Personal Access Token as a secret, for that, you need to generate the PAT for your account by allowing adequate repo source control permission, which could be done by following the steps here. Further if you already have a PAT as a secret you could just skip to selecting the same, or else you need to add the generated PAT by selecting the “+New Secrets” and mentioning the PAT under the “Secret Value” field.

    Secrets

    Be careful not to add your GitHub password under the secrets for GitHub, as some users tend to do this and the connector fails to connect.

  5. Now while connecting to the provider it’s suggested to go for the connect through delegate step as it would allow delegates to perform tasks for you based on your requirements.

    Delegate-Setup

  6. Going further to the Delegate Setup step, I would suggest using any available delegate as a beginner, or if you want to use a particular delegate, select the same and click on the empty field under the same to select and add the delegates.

  7. What’s important to consider here is if you’re an absolute beginner using Harness for the first time, or have never created a delegate, please consider creating a delegate first by selecting the “Install new delegate” and following the resources mentioned here, to move forward and add a connector.

Need further help? Feel free to ask questions at community.harness.io or join community slack to chat with our engineers in product-specific channels like:

  1. #continuous-delivery Get support regarding the CD Module of Harness.
  2. #continuous-integration Get support regarding the CI Module of Harness.

· 3 min read
Krishika Singh

Before we begin :

Let us understand what do we mean by delegates and why is it needed

A Harness delegate is a software that you install in your deployment target environment such as local network ,VPC,or cluster and run as a service.The delegate performs all operations including deployment and integration. The delegate connects all your artifacts,infrastructure,collaboration,verification and other providers with the Harness Manager.

Below we have discussed the detailed explanation of how we can install Kubernetes(K8s) delegate.

Prerequisites

  • Hypervisor technology (VirtualBox, VMWare, etc) is a mandate pre-requisite for Minikube and we have to choose the right one based on the platform we are on.

    Prequisites for minikube

  • Installation section in the Minikube Getting Started documentation is well crafted and has steps for all Linux, Mac & Windows along with the architecture and installer type details and the user just has to choose the required details, get the commands and run them!

    Installing Minikube.

  • Minikube will download the required kubectl as part of the installation and configures it.

Installing Harness Delegate

  • Go to Harness

  • Go to Builds and under Project setup click delegates and then click on new delegates delegate

  • Click on kubernetes

    kubernetes

  • Name your delegate and select the size of delegate and also select delegate permissions. Please follow the correct naming convention for naming a delegate.

    • It will show error when you insert any special characters except ‘-’ and make sure name should not start or end with a number delegate

NOTE:These sizing requirements are for the Delegate only.Your cluster will require more memory for Kubernetes, the operating system, and other services,preferably one should have double the memory and node present in the cluster than that of required for the delegate for smooth functioning.

  • Download the yaml file yaml

  • After clicking on continue open the new terminal and open the directory where you have downloaded the yaml file and then run the following command:

    kubectl apply -f harness-delegate.yml

    download

  • It may take few minutes for verification,after successful installation of delegate following message will be displayed:

download2

  • You can go to the delegate section in the project setup and see the delegate you have installed:

delegate option

  • You can also delete your delegate when no longer in use

Note: Our Kubernetes Delegates are immutable , that is you can only create and delete the delegate but you can’t make any changes to them.